Sprint Velocity in Scrum: How to Measure and Calculate It Right?
Measuring sprint velocity is one of the simplest ways to understand how your Scrum team performs—yet it’s also one of the most misunderstood. Teams often chase higher numbers without realising that inconsistent data, unclear story-point estimation, and changing sprint scope can completely distort velocity. In fact, teams that implement Scrum effectively can improve productivity by up to 300–400%, demonstrating that structure and clarity can significantly enhance outcomes.
But sprint velocity isn’t about speed; it’s about predictability. When measured correctly, it helps teams plan realistic workloads, identify blockers early, and improve delivery accuracy sprint after sprint.
In this post, we’ll break down what sprint velocity really means, how to calculate it correctly, and the best practices to use it as a genuine performance indicator, not just another vanity metric.
In a Nutshell
Sprint velocity quantifies the amount of work a Scrum team completes in a sprint. It uses story points to measure effort, complexity, and risk more effectively than time-based metrics.
To calculate sprint velocity, sum the story points of fully completed user stories per sprint and average them across several sprints to establish a stable, predictable delivery rate.
Tracking and analyzing velocity helps engineering teams plan realistically, understand capacity constraints, and forecast delivery timelines with data-backed confidence.
Agile tools, such as burndown charts, velocity charts, and boards, visualize progress, identify deviations early, and enhance sprint transparency and planning accuracy.
Avoid common pitfalls, such as comparing teams, tracking individual velocity, or chasing higher numbers, to maintain sustainable performance and meaningful improvement.
What is Sprint Velocity in Scrum?
In Scrum, sprint velocity measures how much work a Scrum team can complete during a single sprint. It’s expressed in story points, which quantify effort, complexity, and risk, giving teams a more accurate sense of scope than time-based estimates.
What It Means:
For developers, this means visibility into how much work can realistically be accommodated within a sprint without overloading the team.
For engineering managers, it becomes a reliable input for sprint planning and forecasting.
For engineering leaders, Scrum velocity acts as an objective indicator of delivery rhythm and process efficiency across teams.
Here’s how it works: A team assigns story points to each user story based on the perceived effort, such as 3 points for building a login screen and 8 points for integrating a payment gateway (for instance). At the end of the sprint, the total of all completed story points represents that sprint’s velocity.
Example: If your team delivers stories worth 13, 8, and 3 story points, your sprint velocity equals 24 story points for that sprint.
Over time, teams can track velocity trends across multiple sprints to identify their stable delivery rate, helping managers forecast timelines and leaders estimate organizational throughput without micromanaging progress.
Also Read: Understanding Development Velocity in Software Engineering
With a clear understanding of what sprint velocity is, the next step is learning how to measure and calculate it accurately within your Scrum framework.
How to Track, Measure, and Calculate Sprint Velocity in Scrum?
Calculating sprint velocity is one of the most effective ways to understand how your engineering team delivers value. It helps teams set realistic expectations, forecast timelines, and continuously refine sprint planning. But beyond the math, it’s about creating a shared rhythm where developers, engineering managers, and leaders move in sync based on real data, not assumptions.
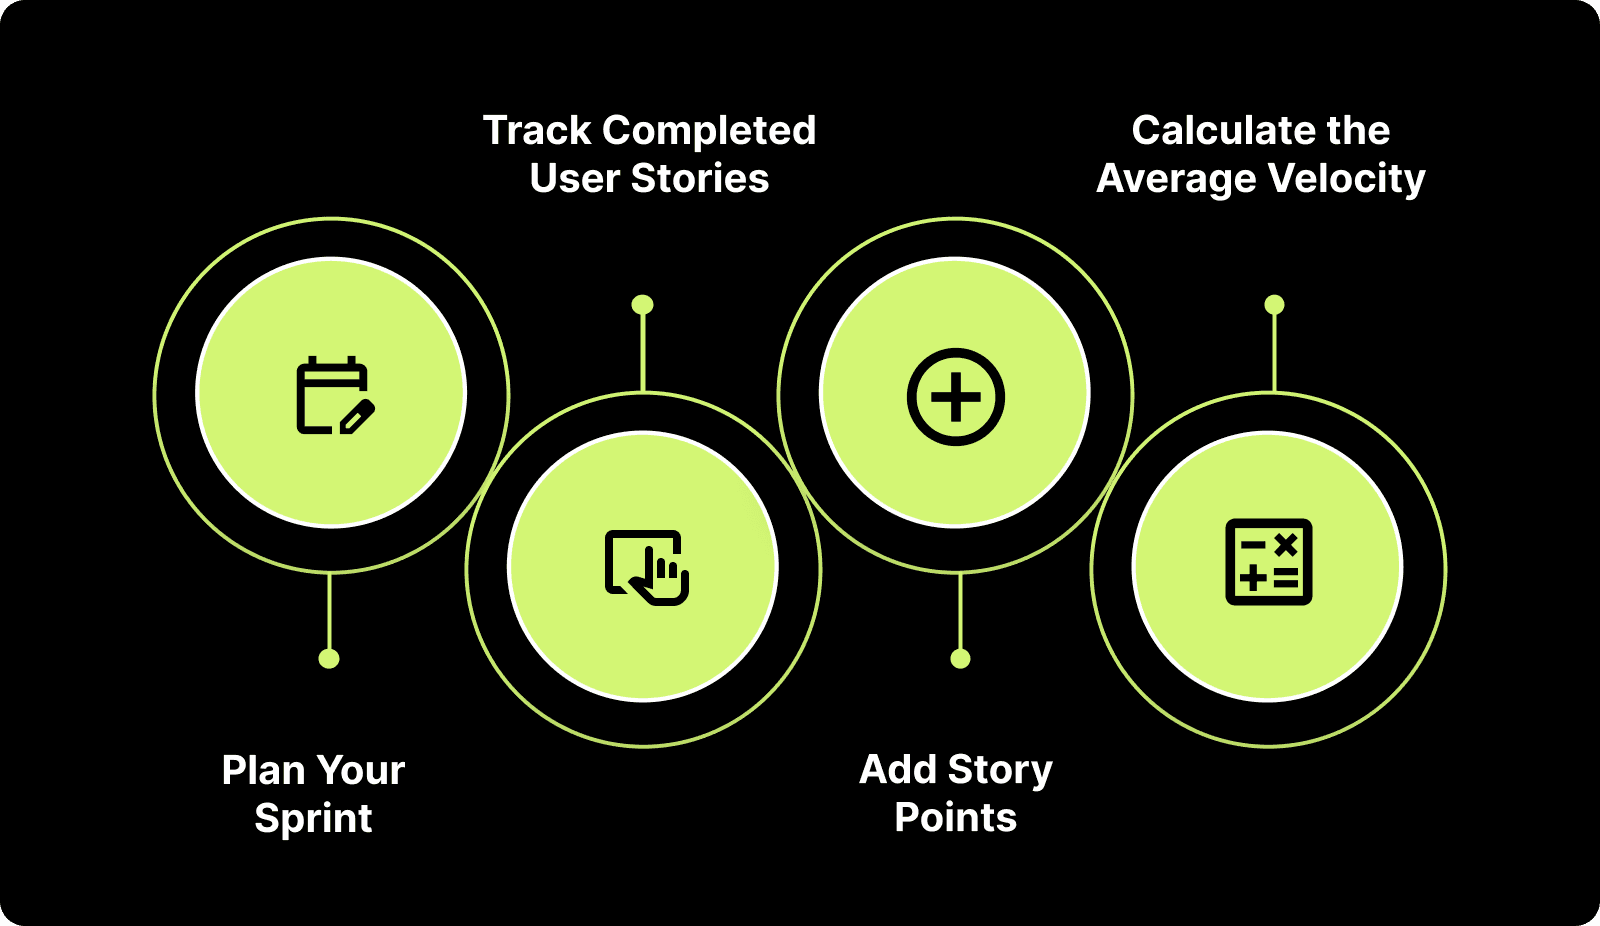
Here’s how to accurately measure and calculate Scrum velocity step by step.
Step 1: Plan Your Sprint and Assign Story Points
Before each sprint, select user stories from the product backlog and estimate them using story points, a relative scale that measures effort, complexity, and risk.
Instead of abstract examples like “add a login screen,” here’s what it may look like for a modern engineering organization:
Example User Stories | Story Points |
|---|---|
Refactor legacy authentication service | 5 |
Integrate third-party billing API | 8 |
Optimize database indexing for analytics pipeline | 13 |
Implement Slack notifications for build failures | 3 |
Migrate configuration files to YAML | 2 |
Enhance the CI/CD pipeline with automated security checks | 21 |
Build an internal metrics dashboard for PR analytics | 5 |
Pro Tip (for engineering managers): If your team’s average sprint velocity from past iterations is 30 points, but you anticipate a reduced capacity due to a release freeze or holidays, plan for about 25–27 points. Consistency matters more than squeezing in extra scope.
Step 2: Track Completed User Stories
At the sprint’s end, list only the user stories that meet acceptance criteria and have been merged, reviewed, and approved.
If a story like “Refactor legacy authentication service” is 90% done but still pending final QA or code review, it doesn’t count toward this sprint’s velocity. It rolls into the next.
Key Insight: Counting incomplete work inflates metrics and misleads planning. For accurate agile velocity calculation, only include stories that are entirely done and deployed (or ready for release).
Step 3: Add Story Points
Add up the story points of all completed user stories at the end of the sprint.
Example:
Refactor legacy authentication service: 5 points
Integrate third-party billing API: 8 points
Implement Slack notifications for build failures: 3 points
Sprint Velocity = 5 + 8 + 3 = 16 story points
This 16-point Scrum velocity reflects actual delivery output, not just effort spent.
Step 4: Calculate the Average Velocity
A single sprint’s result (like 16 story points) gives an immediate snapshot. To establish a dependable benchmark, average your velocity over at least the last three sprints. For instance:
Sprint | Completed Story Points |
|---|---|
Sprint 1 | 16 |
Sprint 2 | 18 |
Sprint 3 | 20 |
Average Velocity = (16 + 18 + 20) / 3 = 18 story points
That average velocity of 18 now reflects your team’s true, sustainable pace, factoring in variability, carryovers, and completed backlog work. Once you capture this for a few iterations, patterns begin to form. That’s when sprint velocity becomes a planning signal.
Pro Tip (for engineering leaders): Don’t chase a higher number. A stable average sprint velocity is more valuable than fluctuating spikes in speed. It indicates a mature, predictable delivery process.
Interpretation: Plan the next sprint around the previous average sprint velocity (say 20 story points). Say 19–21 points. This helps developers focus on realistic goals and gives leaders data-backed confidence in delivery timelines.
When your team’s average sprint velocity is established, the numbers start telling a deeper story. Now, let’s look at why sprint velocity truly matters for engineering teams.
Why Sprint Velocity Matters for Engineering Teams
When used effectively, sprint velocity becomes a practical tool for engineering teams to plan better, stay aligned, and make delivery more predictable. From capacity planning to continuous improvement, here’s how understanding and applying velocity data strengthens every layer of your organization.
1. Plan Realistically, Deliver Confidently
Historical velocity data helps teams set achievable sprint goals. Realistic planning aligns team expectations, minimizes stress, and establishes a repeatable rhythm of success.
Example: An engineering team building a new analytics dashboard commits to roughly 50 points per sprint, splitting them across frontend features (20), backend optimizations (15), and automated tests (15). This balanced load ensures quality and timely delivery.
2. Understand Team Capacity and Constraints
Sprint velocity also reveals your team’s actual capacity, taking into account team size, skill sets, stability, experience levels, complexity of user stories, and external dependencies or constraints such as cross-functional teams or holidays.
A sudden dip or surge often highlights operational shifts rather than productivity swings. For example:
Capacity Factor | Typical Impact on Sprint Velocity | Example |
|---|---|---|
Developer PTO or onboarding | Temporary drop | Velocity dips from 50 to 42 |
Infrastructure issues or outages | Slower progress | Reduced throughput by 20% |
New automation tools adopted | Gradual rise | Velocity increases from 45 to 55 |
3. Drive Continuous Improvement
Tracking the velocity of a scrum team across multiple sprints reveals patterns that guide improvement. If the number climbs steadily, it means your process changes (like refining backlog grooming or managing reviews) are working.
Example: A backend team’s velocity rises from 38 → 42 → 48 → 54 → 56 points after implementing automated test generation and an AI-assisted documentation process.
Key Takeaway: Velocity trends indicate which experiments are successful. Drops point to process bottlenecks or blockers that require attention. Treat fluctuations as feedback, not failure.
Also Read: Sprint Review Guide: Definition, Goals, and Tips
4. Forecast Project Timelines with Clarity
Velocity provides a data-backed foundation for forecasting project timelines and resource needs.
If your average velocity is 50 points and your backlog totals 200 points, you can confidently project roughly four sprints to completion, provided there are no significant hiccups. This clarity helps leaders and product owners allocate time, resources, and budgets more effectively.
Pro Tip: Always recalculate velocity when the scope changes or priorities shift, as agile planning is dynamic by design.
5. Identify Overcommitment or Undercommitment Early
Velocity deviations help detect planning misalignments before they cause delivery risks.
A drop from 50 to 30 points might signal blockers, unclear requirements, or excessive workload.
A spike to 70 points could indicate underestimation or under-challenging sprint goals.
Adjust team scope or story sizing accordingly to restore balance.

Recognizing the importance of sprint velocity is essential. However, to translate that understanding into consistent delivery and more intelligent forecasting, you need reliable tools that make velocity measurable, transparent, and actionable.
Practical Tools to Monitor Sprint Velocity in Scrum
Tracking sprint velocity effectively requires visibility across work items, progress, and capacity. Modern Agile tools consolidate scattered metrics into actionable insights, enabling teams to stay aligned and informed by data.
Here are three core tools that help Scrum teams monitor, measure, and improve velocity across sprints:
1. Burndown Chart: A burndown chart visualizes how much work remains in a sprint versus how much time is left. The Y-axis represents the total story points, and as tasks are completed, the line “burns down” toward zero.
Why it matters:
Offers a real-time view of sprint progress.
Helps detect when the team is behind schedule, allowing for early adjustments.
Encourages transparency and accountability during standups.
2. Agile Board: An Agile board (in tools like Entelligence AI, Jira) serves as the command center for all sprint activities. It visually represents user stories, tasks, and their progress through columns such as To-Do, In Progress, and Done.
Agile Board Feature | Benefit for Teams |
|---|---|
Story point tracking | Ensures balanced sprint commitments |
Assignee and dependency view | Clarifies ownership and reduces bottlenecks |
Configurable task cards | Customize data fields like test coverage or PR status |
Capacity vs. allocation view | Quickly shows if the team is over- or underloaded |
3. Velocity Chart: The velocity chart summarizes how much work a Scrum team has completed in recent sprints, making it one of the most powerful tools for forecasting and continuous improvement.
How it helps:
Shows completed story points per sprint, revealing long-term delivery patterns.
Highlights whether team capacity and output are aligned.
Helps forecast project timelines by extrapolating average velocity.
Also Read: Top 8 Developer Productivity Tools For Maximum Efficiency

Even with the right tools in place, it’s easy to misinterpret what sprint velocity really means. Understanding its common pitfalls ensures you use it as a guide, not a pressure metric.
Common Pitfalls When Using Sprint Velocity in Scrum
While sprint velocity is a valuable metric for forecasting and planning, it’s also one of the most misunderstood in Scrum. Misinterpreting or misusing velocity can lead to distorted performance assessments, unhealthy team dynamics, and inaccurate reporting.
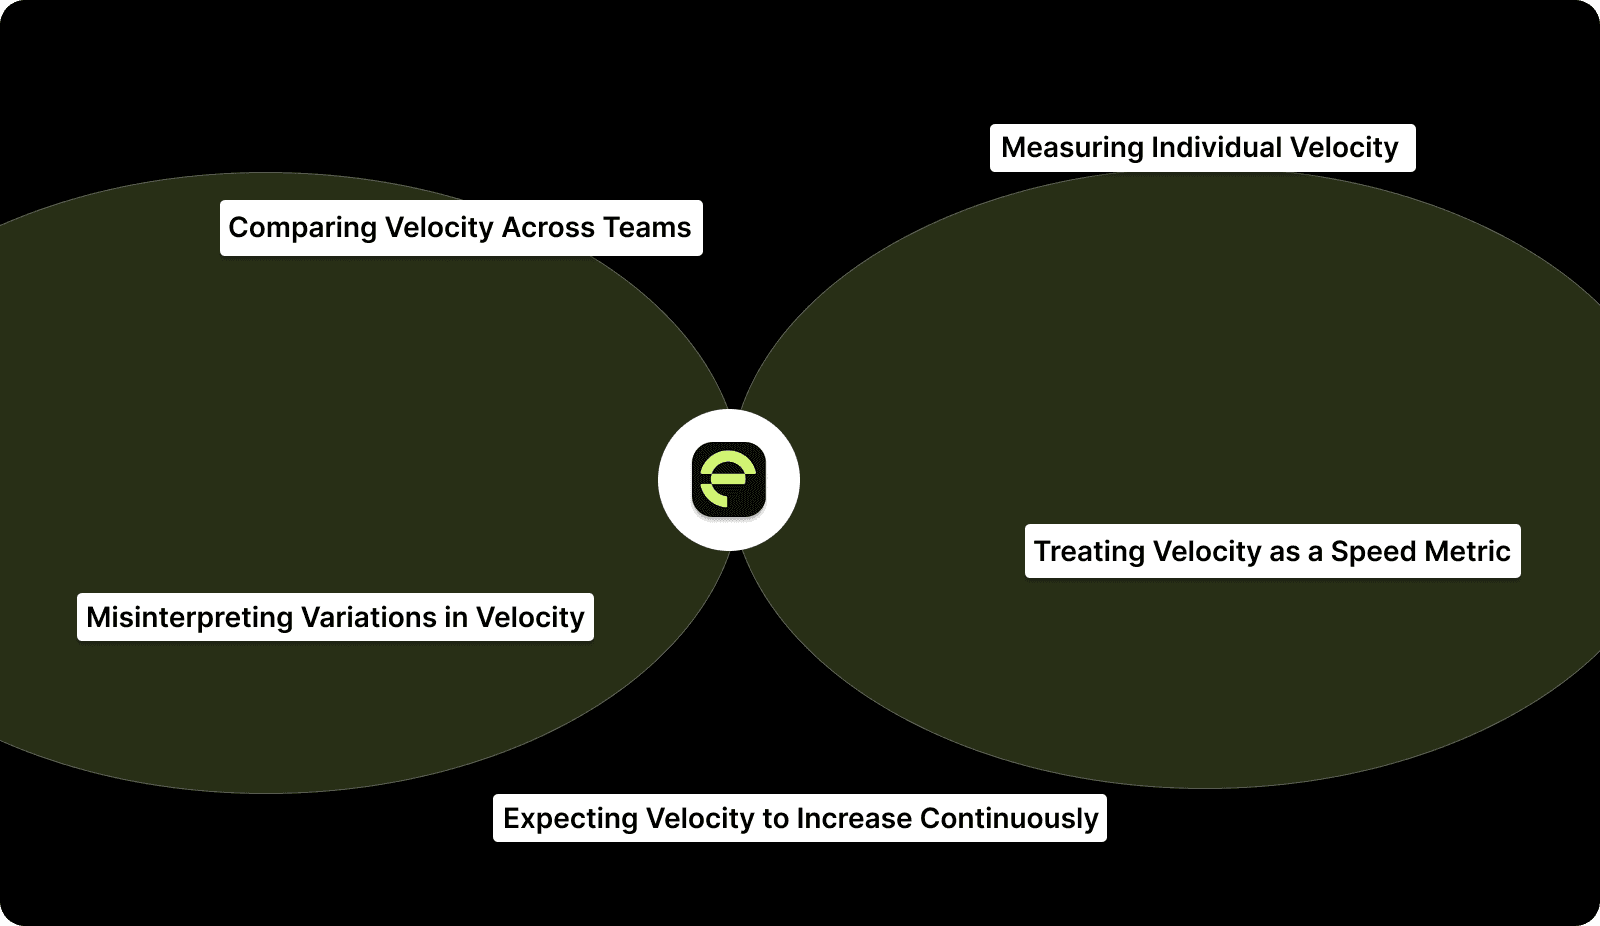
Here are the most common pitfalls to watch out for, and how to avoid them:
1. Comparing Velocity Across Teams
Velocity is contextual, not competitive. It varies significantly based on team size, sprint length, estimation practices, and even technology stacks. A backend team delivering 30 points per sprint may be performing just as efficiently as a frontend team delivering 45 points, given the difference in story complexity.
Why it’s a problem: Comparing teams on velocity creates unhealthy competition, incentivizes story point inflation, and discourages collaboration.
Better approach: Treat each team’s velocity as an internal benchmark. Focus on trends within the team: is it stable, improving, or fluctuating? Use those insights to drive continuous improvement.
2. Measuring Individual Velocity
Tracking velocity per developer contradicts the core principles of Scrum. The framework is built on shared accountability, where the team, not individuals, owns sprint outcomes.
Why it’s a problem: Individual velocity tracking leads to finger-pointing, reduced trust, and short-term thinking. It also overlooks the collaborative work, such as reviews, testing, and mentoring, that doesn’t directly translate into story points.
Better approach: Measure team outcomes such as cycle time reduction, fewer blocked PRs, or improved sprint predictability. These indicators more accurately reflect collective productivity.
3. Treating Velocity as a Speed Metric
Velocity measures output consistency, not speed. It represents how much value a team delivers sustainably per sprint, rather than how quickly they can complete stories.
Why it’s a problem: When velocity is mistaken for speed, teams rush work, cut testing corners, and compromise code quality.
Example: If your team’s sprint velocity drops after implementing more rigorous code reviews, that’s not a red flag; it likely means that quality standards have improved; productivity hasn't declined.
4. Expecting Velocity to Increase Continuously
A healthy team doesn’t necessarily have an ever-rising velocity. After an initial calibration period, most mature Scrum teams reach a steady-state velocity that reflects their optimal capacity.
Why it’s a problem: Pushing for continuous velocity growth creates unrealistic expectations and can cause burnout or artificial estimation inflation.
Better approach: Aim for consistency, not escalation. Stable sprint velocity indicates predictable delivery, which is a far more valuable outcome than raw speed.
5. Misinterpreting Variations in Velocity
Velocity naturally fluctuates due to legitimate factors, such as team member availability, sprint scope complexity, or dependency delays.
Why it’s a problem: Leaders sometimes overreact to small dips, assuming performance issues where there are none.
Better approach: Analyze velocity alongside qualitative factors such as retrospective notes, blocker frequency, or cycle time trends to gain a comprehensive understanding of performance health.

How Entelligence AI Simplifies Sprint Velocity Tracking and Improvement?
Accurately measuring sprint velocity often becomes a challenge for engineering teams. Data lives across disconnected systems, such as GitHub, Jira, Slack, and gathering it manually can take hours. Even with visibility, leaders often struggle to connect story points with tangible outcomes, such as code quality, team health, or delivery predictability. The result? Fragmented insights, inconsistent planning, and missed opportunities for continuous improvement.
Entelligence AI bridges this gap by transforming how velocity is tracked, analyzed, and improved. It consolidates data across tools, automatically surfaces sprint health insights, and provides actionable metrics for developers, managers, and leaders, all within a single unified platform.
Here’s how we help:
AI-Powered Sprint Assessments: Automatically tracks planned vs. completed story points, identifies blockers, and generates sprint retrospectives without manual effort.
Smart Sprint Planning: Utilizes AI to analyze historical velocity trends and suggest realistic sprint scopes, preventing overcommitment or underutilization.
Contextual Reports for Decision-Making: Consolidates code, sprint, and performance data into actionable dashboards for leaders and managers.
Individual & Team Insights: Provides detailed analytics on commits, PR activity, and code quality to identify opportunities for improvement and recognition.
Leaderboards & Gamification: Motivates teams with quality-driven engagement metrics, encouraging accountability and collaboration.
Smooth Integrations: Connects directly with Jira, Slack, VS Code, Notion, and GitHub to centralize insights and eliminate context-switching.
With Entelligence AI, your team can accurately measure sprint velocity, plan confidently, and continuously improve performance, without sacrificing quality or team well-being.
Conclusion
Every sprint tells a story: how the team planned, executed, and adapted to meet its goals. Tracking sprint velocity turns that story into meaningful insights. From assigning story points to tracking completed work, each step helps teams plan realistically, forecast accurately, and continuously improve their sprints. When you focus on steady, data-driven improvement, rather than just speed, you build a foundation for predictable delivery and long-term success.
That’s where Entelligence AI has the greatest impact. By unifying sprint data from tools like Jira and GitHub, automating performance tracking, and generating actionable insights, we help engineering teams move from a reactive to a strategic approach. Leaders can see velocity trends at a glance, identify bottlenecks early, and make informed decisions that drive sustainable improvement.
Ready to make every sprint more predictable and productive? Try Entelligence AI today and experience how intelligent velocity tracking improves your team’s performance.
Frequently Asked Questions
Q: What is the difference between sprint velocity and burndown?
Sprint velocity measures the total amount of work completed in previous sprints, typically in story points, and helps forecast future capacity. A burndown chart, on the other hand, provides a real-time view of work remaining in the current sprint, showing whether the team is on track to meet its sprint goal and identifying risks or slowdowns early.
Q: How do we determine story points for user stories?
Start by picking an easy, familiar story as the baseline (1 point). Then, compare each new story’s complexity, effort, and uncertainty against that of the others. Use a linear (1,2,3,4…) or Fibonacci (1,2,3,5,8,13…) scale to assign relative values consistently across the backlog.
Q: What is a sprint retrospective in Scrum?
In Scrum, a sprint retrospective is a meeting held at the end of each sprint where the team reviews successes, challenges, and opportunities for improvement. It helps refine processes, strengthen collaboration, and enhance performance in upcoming sprints.
Q: What can product managers learn from sprint velocity trends?
Velocity data helps product managers align delivery capacity with roadmap priorities. By knowing the team’s average velocity, PMs can forecast feature completion timelines, adjust scope intelligently, and manage stakeholder expectations using concrete, data-backed metrics rather than intuition or deadlines alone.
Q: How does sprint velocity relate to engineering quality metrics?
Velocity alone doesn’t indicate code quality, but when paired with metrics such as defect density, review quality, or test coverage, it paints a more comprehensive picture. Stable velocity alongside improving quality metrics signals a healthy flow; increasing velocity with a drop in quality suggests technical debt accumulation.