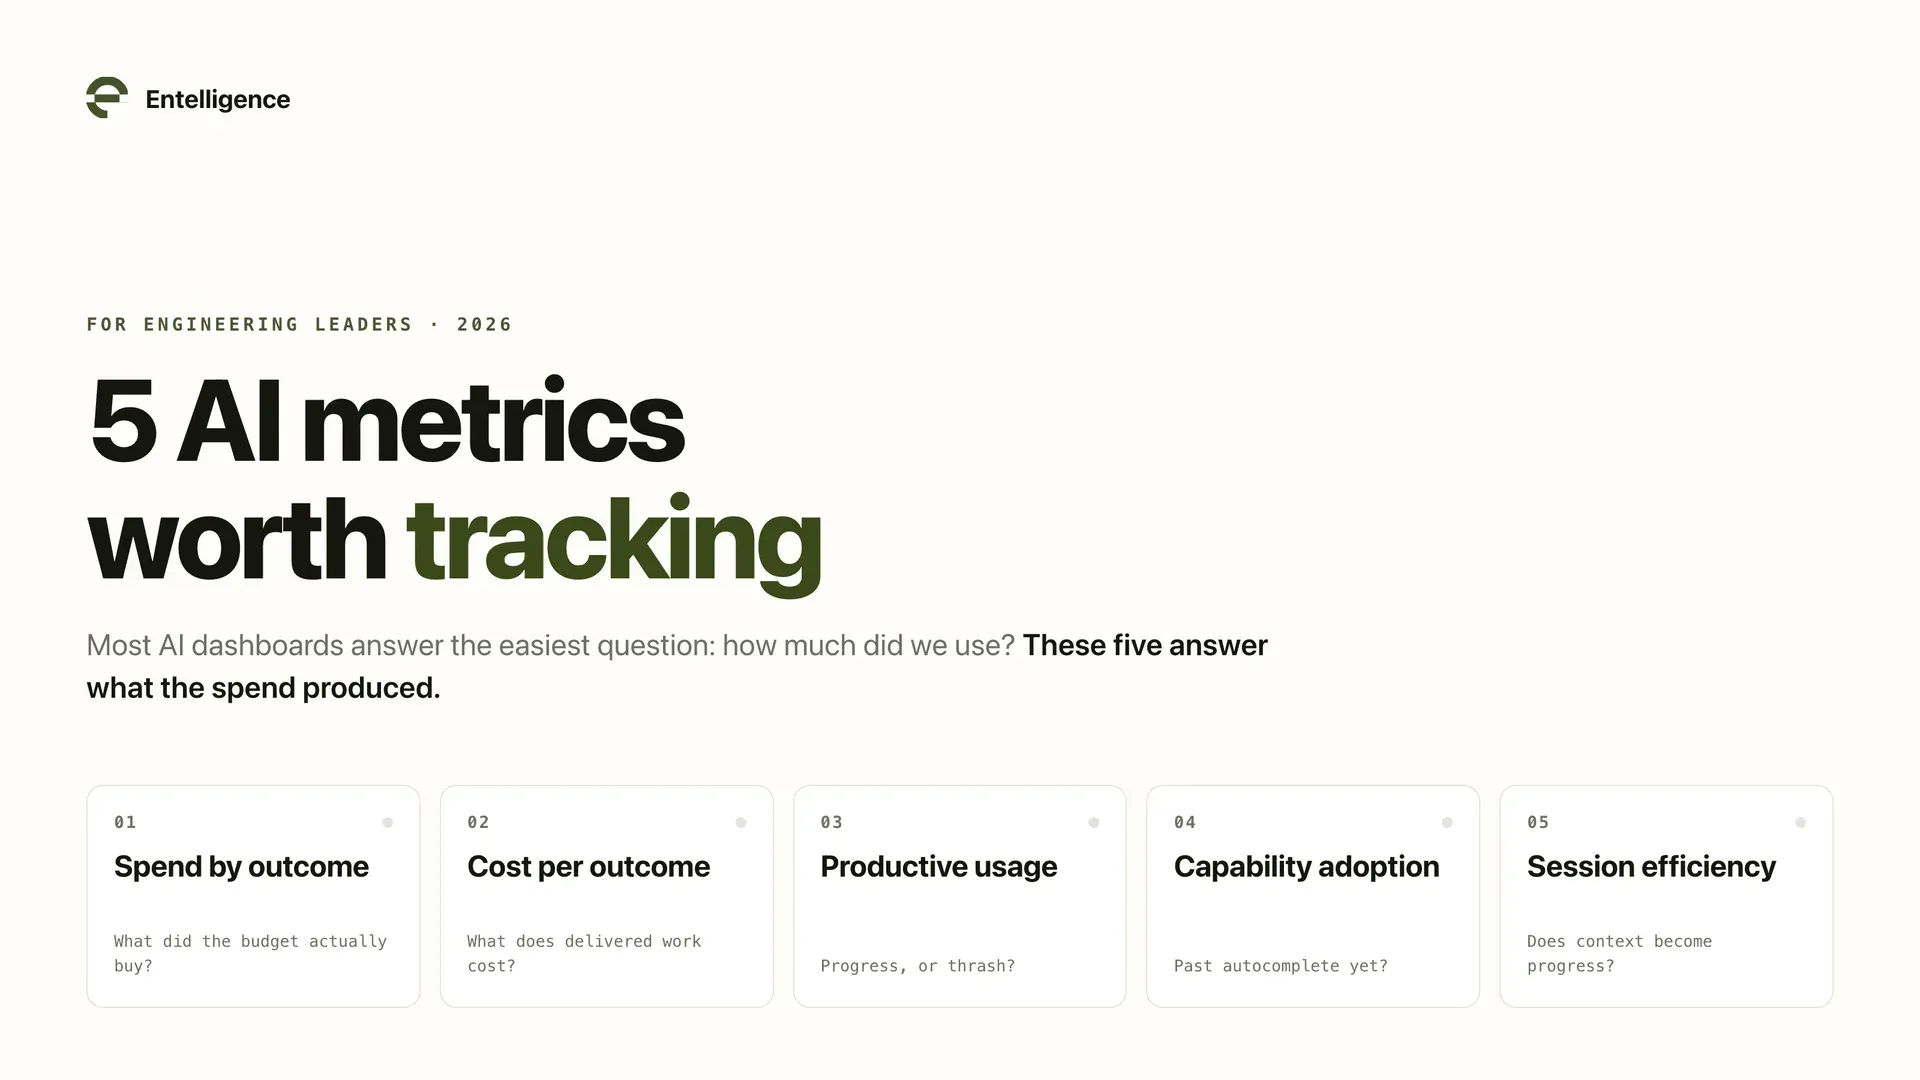
5 AI Metrics Every Engineering Leader Should Track
Aditya Jha
Software Development Metrics
Aditya Jha
Software Development Metrics

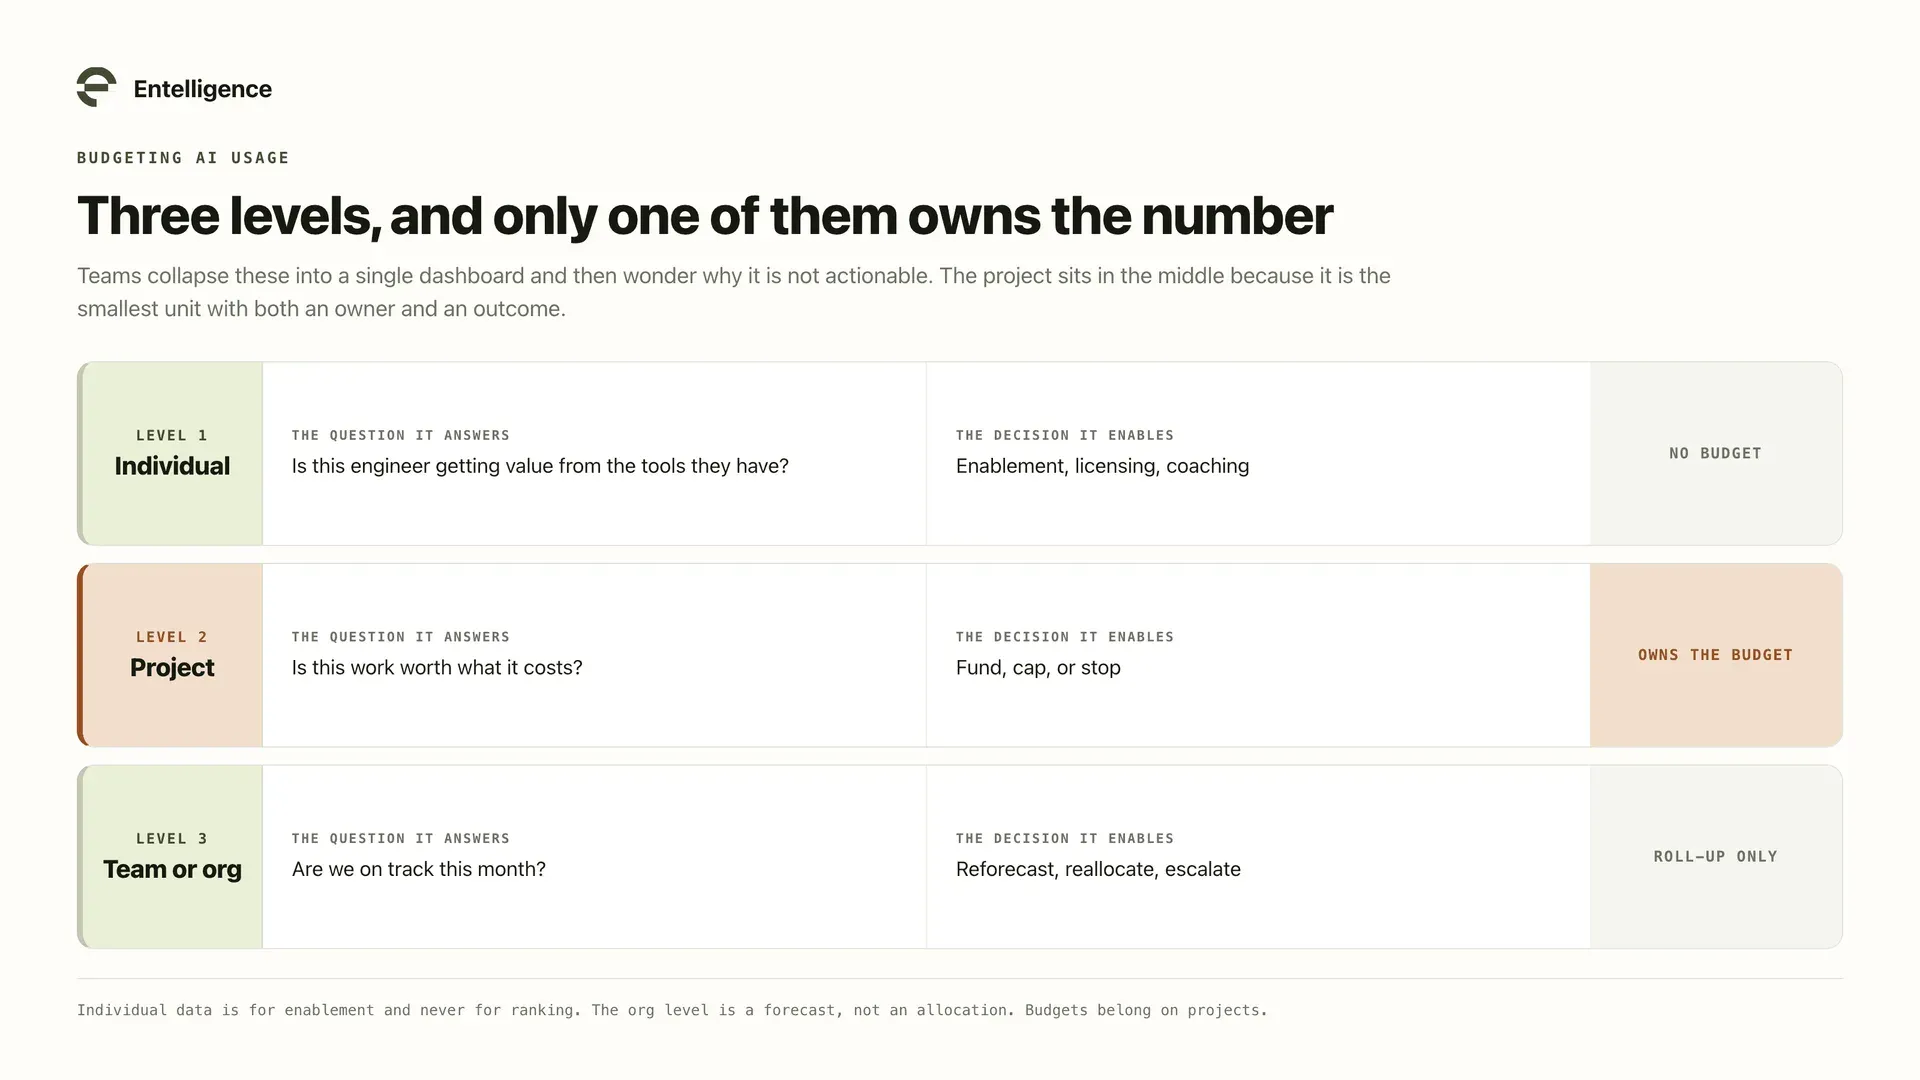
Most AI dashboards answer the easiest question: How much did we use?
Seats, sessions, tokens, total spend. Useful for billing. Not enough to run an AI program, which needs to know where the money went, whether the usage produced work, and where sessions burn time. That takes a different scorecard:
AI spend by outcome
Cost per meaningful engineering outcome
Productive AI usage versus exploration and overhead
AI capability adoption
AI session efficiency
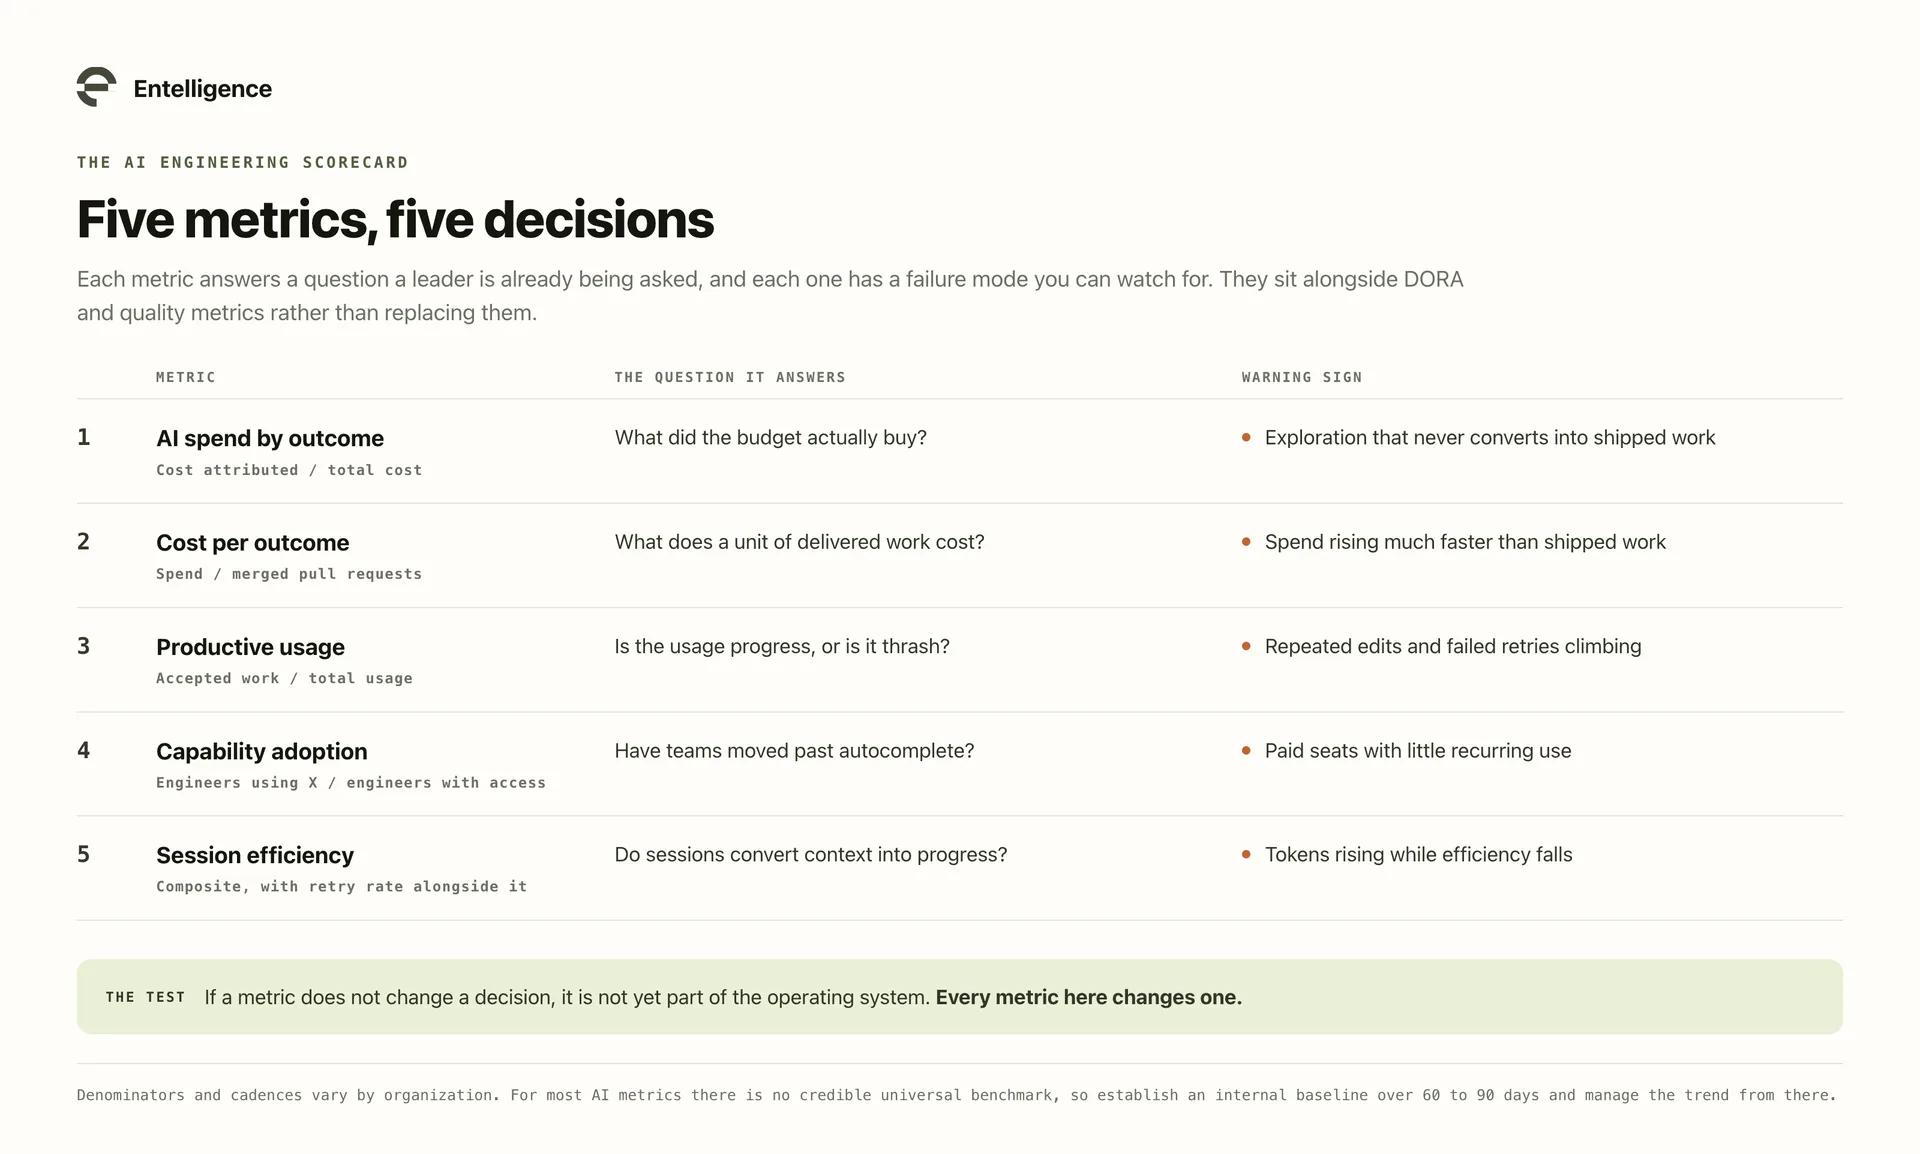
They sit alongside DORA and quality metrics rather than replacing them.
Why traditional engineering metrics are not enough
DORA, cycle time, throughput, and defect rates remain the backbone of engineering measurement. Keep them. They just cannot answer the AI questions:
The AI question | What a delivery metric shows instead |
|---|---|
Which tools and models consume the budget | Nothing. Spend sits outside the delivery system. |
How token and context usage changes between workflows | Cycle time, with no way to attribute the change |
Whether agent sessions make progress or repeat themselves | A merged pull request, however many attempts it took |
How deeply teams adopt agent capabilities | Throughput, which a single power user can lift |
Which engineering outcomes the AI activity supports | The outcome, with no line back to the spend |
AI also moves those metrics in opposite directions at once. The 2025 DORA report associated higher AI adoption with increased delivery throughput and increased instability. Watching only those two shows the effect without the cause.
Perception is no substitute either. In a randomized controlled trial by METR, experienced developers in mature repositories took 19% longer with AI, having predicted a 24% speedup and still believing afterward they were 20% faster.
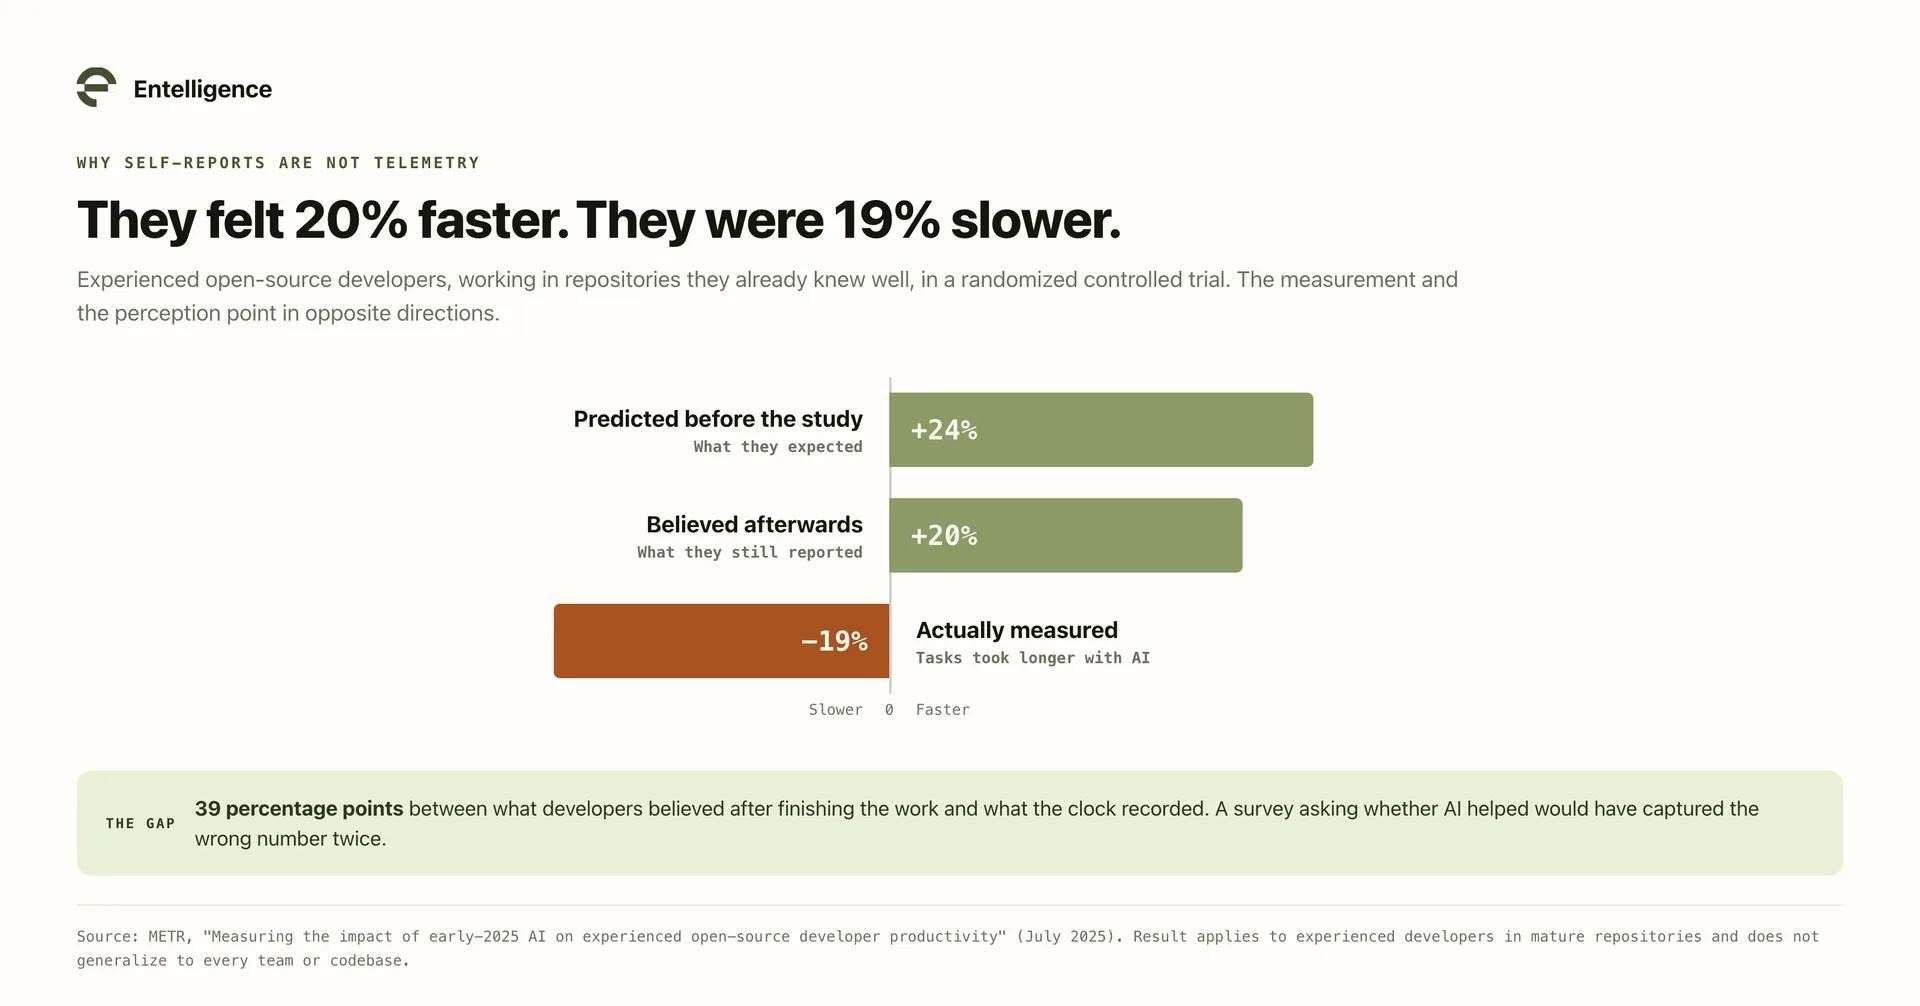
A survey would have recorded a win here.
Metric 1: AI spend by outcome
Definition: The share of AI spend allocated to features, fixes and rework, tests and reviews, and exploration and overhead.
AI spend by outcome (%) = AI cost attributed to an outcome category / total AI cost × 100
Total spend tells you how large the bill is. This tells you what it represents. Two teams, same $30,000 a month, illustrative allocations:
Illustrative outcome split | Team 1 | Team 2 |
|---|---|---|
Features created | 55% | 20% |
Tests and reviews | 20% | 10% |
Fixes and rework | 15% | 30% |
Exploration and overhead | 10% | 40% |
Monthly AI spend | $30,000 | $30,000 |
The invoice total is identical. The management decision is not.
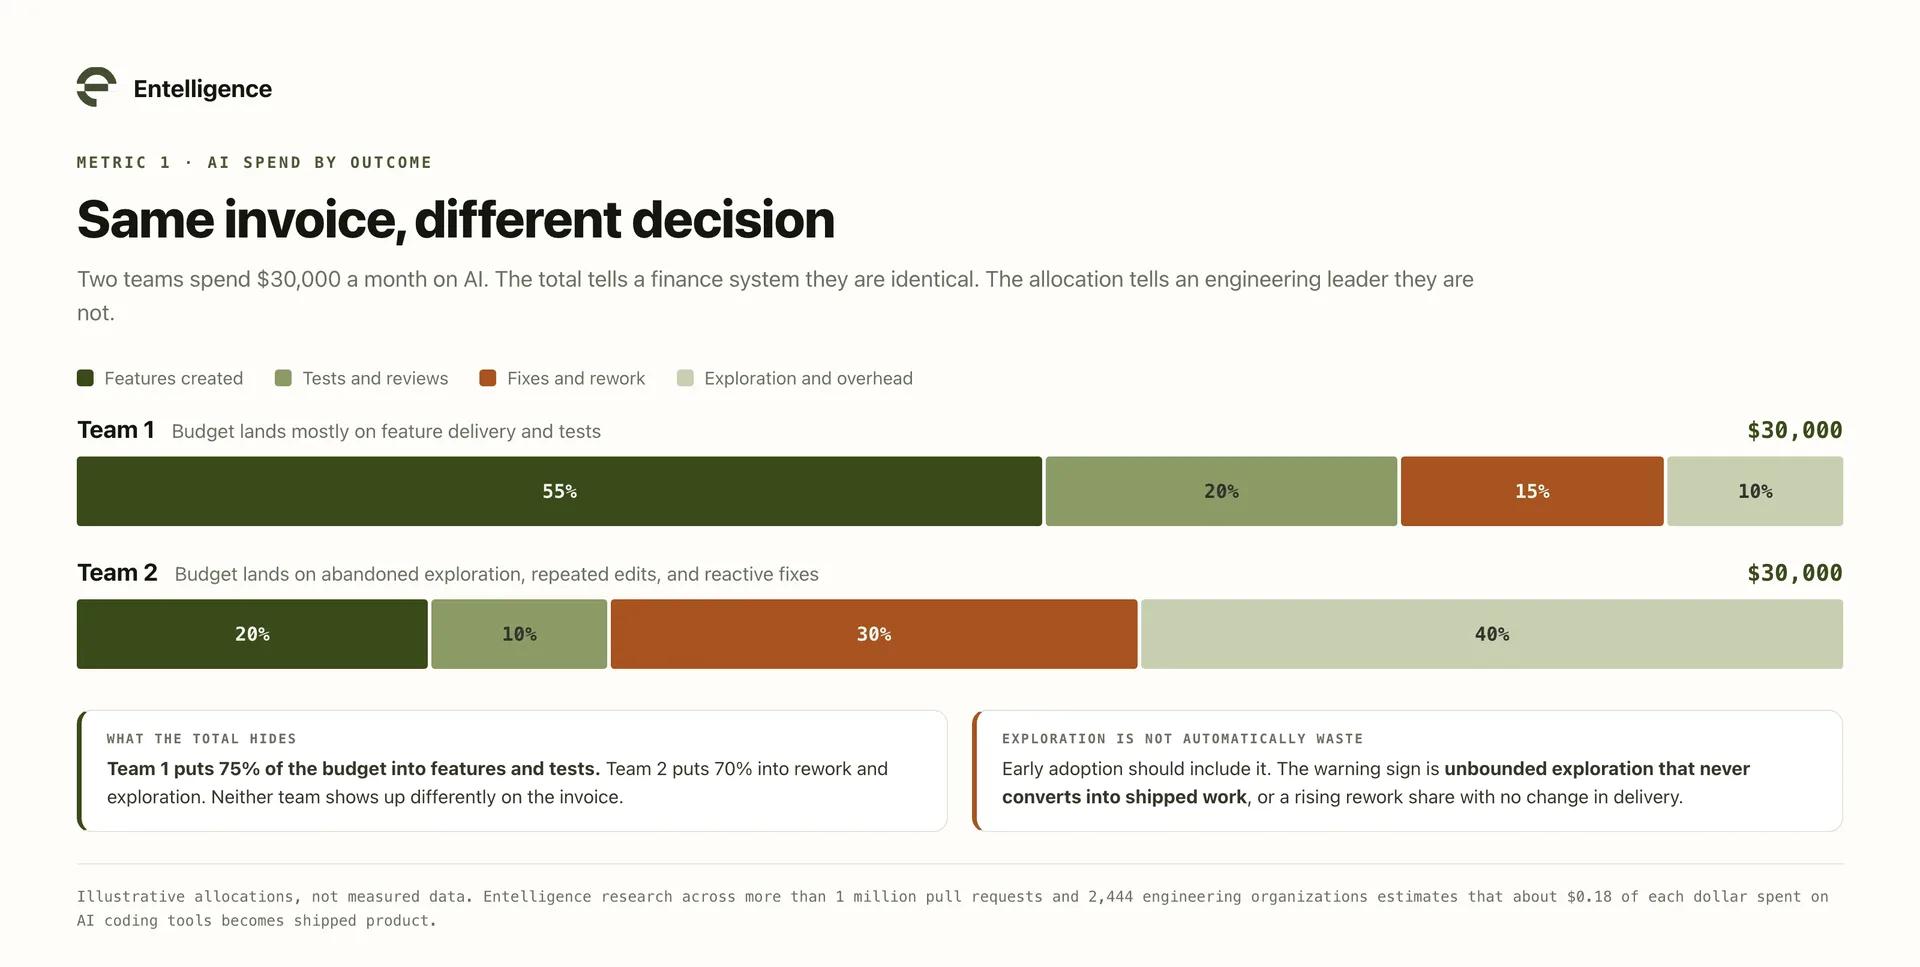
Entelligence research across more than 1 million pull requests and 2,444 organizations estimates that about $0.18 of each dollar spent on AI coding tools becomes shipped product. That is vendor-produced research, not a universal benchmark, but it shows why allocation matters.
Watch for unbounded exploration that never converts, or rework rising with no change in delivery. Zero exploration is not the target. Segment it, because an org-wide average hides one team spending 60% on exploration while another spends 5%. Decides where to raise, hold, or cut a budget. Agent Insights shows the allocation, including untracked spend.
Metric 2: Cost per meaningful engineering outcome
Definition: AI spend divided by a countable unit of delivered work. Start with a denominator you can measure consistently.
Cost per merged pull request = AI spend attributed to development work / AI-assisted merged pull requests
Team | AI spend | AI-assisted merged PRs | Cost per merged PR |
|---|---|---|---|
Team 1 | $9,600 | 320 | $30 |
Team 2 | $14,000 | 200 | $70 |
Those hypothetical figures do not prove Team 1 is better. The teams may work on different systems, and as Microsoft Research notes, a merged PR is not equivalent to the value it delivers. It still beats reporting 38 billion tokens.
Watch for spend rising faster than shipped work. Compare within similar work and pair it with change failure rate and PR size, so nobody improves the number by splitting work. Decides model and vendor selection: if frontier models double the cost of routine outcomes with no quality gain, the placement policy should change, which is the case for an LLM router. Upgrade the denominator toward shipped features as attribution matures.
Metric 3: Productive AI usage versus exploration and overhead
Definition: The share of usage that reaches accepted or shipped work, against usage lost to retries, repeated edits, abandoned sessions, and oversized context.
Productive usage rate = AI usage attributed to accepted or shipped work / total AI usage
Perfect attribution is hard. Start with one minus the share of tokens consumed by identifiable overhead. High consumption can look like engagement while being thrash:
Source | Finding |
|---|---|
GitClear analysis of 211 million changed lines | Code churn rose from 3.3% to 5.7% in the AI era. |
66% encounter AI solutions that are almost right but not quite; 45% say debugging AI-generated code takes more time. |
Watch for outlier sessions eating a large share of tokens, rising retries, and expensive models looping on tasks they never finish. Segment by session type, since interactive pairing and background agents have different shapes. Do not call all exploration waste: bounded prototyping that informs delivery is productive. Decides where to fix context hygiene, guardrails, or task specs before adding budget.
Metric 4: AI capability adoption
Definition: The percentage of a team actively using specific agent capabilities, not merely holding a license.
Capability adoption rate (%) = engineers who used capability X during the period / engineers with access × 100
Track each capability separately. Each signals something different:
Capability | What its adoption signals |
|---|---|
Plan mode | Engineers are directing the work instead of accepting whatever arrives |
Skills | Successful practices have been captured and shared rather than re-invented |
Current recommended models | Teams are not stranded on a model that was current last quarter |
Sub-agents | Work is being decomposed, not handed over as one large prompt |
MCP tools | Agents can reach real systems, which raises both the value and the risk |
Task tracking | Agent work is visible and reproducible after the fact |
Seat activation is the weakest possible signal. One accepted autocomplete makes a developer look active in a vendor report.
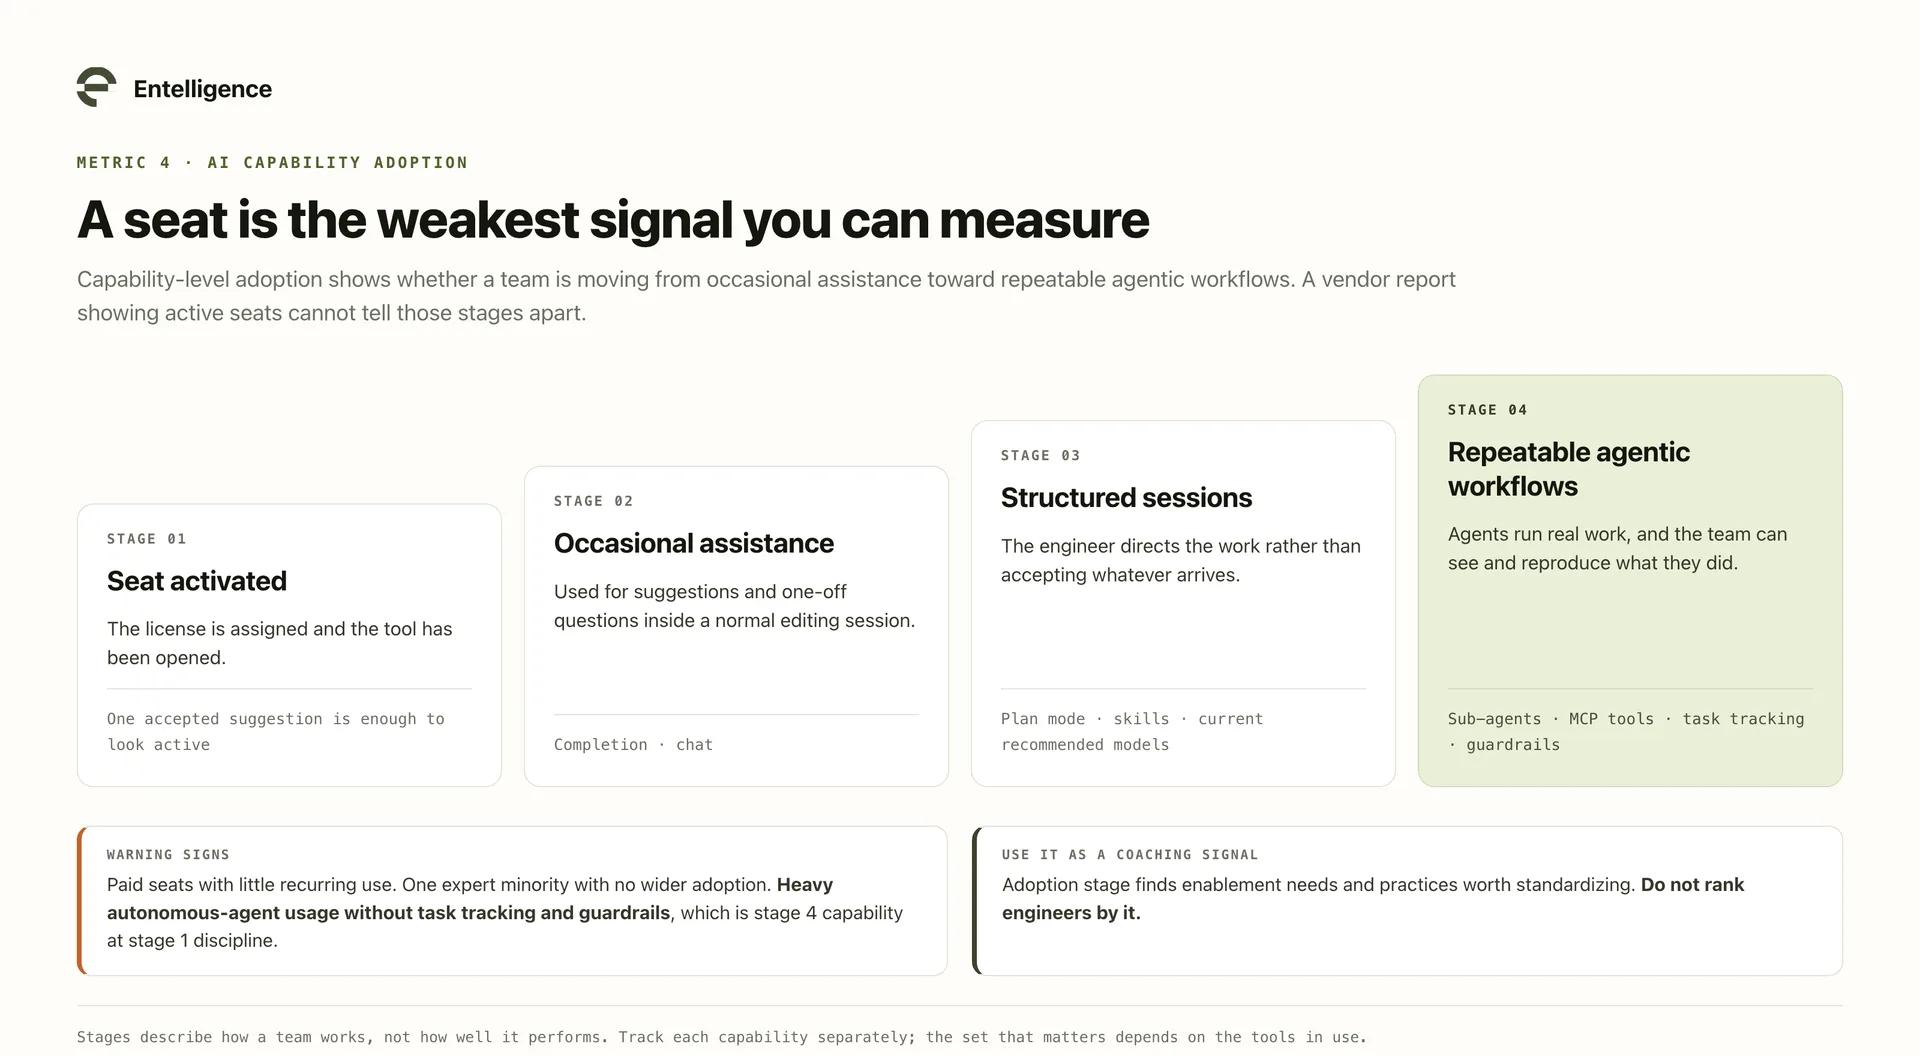
Watch for paid seats with little recurring use, an expert minority with no wider spread, or heavy autonomous-agent use without task tracking and guardrails. Decides training, license rightsizing, and which champions' practices to standardize. One caveat matters most: adoption stage is a coaching signal, not a performance score. Do not rank engineers by it.
Metric 5: AI session efficiency
Definition: How effectively a session converts context and tool use into progress, complemented by retry rate.
Retry rate (%) = retried agent actions / total agent actions × 100
Efficiency itself is usually a composite. Define yours explicitly and keep it stable, because a metric that changes meaning each quarter cannot show a trend. Two teams with identical spend and adoption can still work in very different environments:
Efficient session environment | Inefficient session environment |
|---|---|
Clear tasks | Repeated interruptions |
Reliable tests | Re-prompting |
Permissions needed to finish | Retries around missing context |
Delivery metrics surface that gap weeks later, when the workflow is no longer fresh.
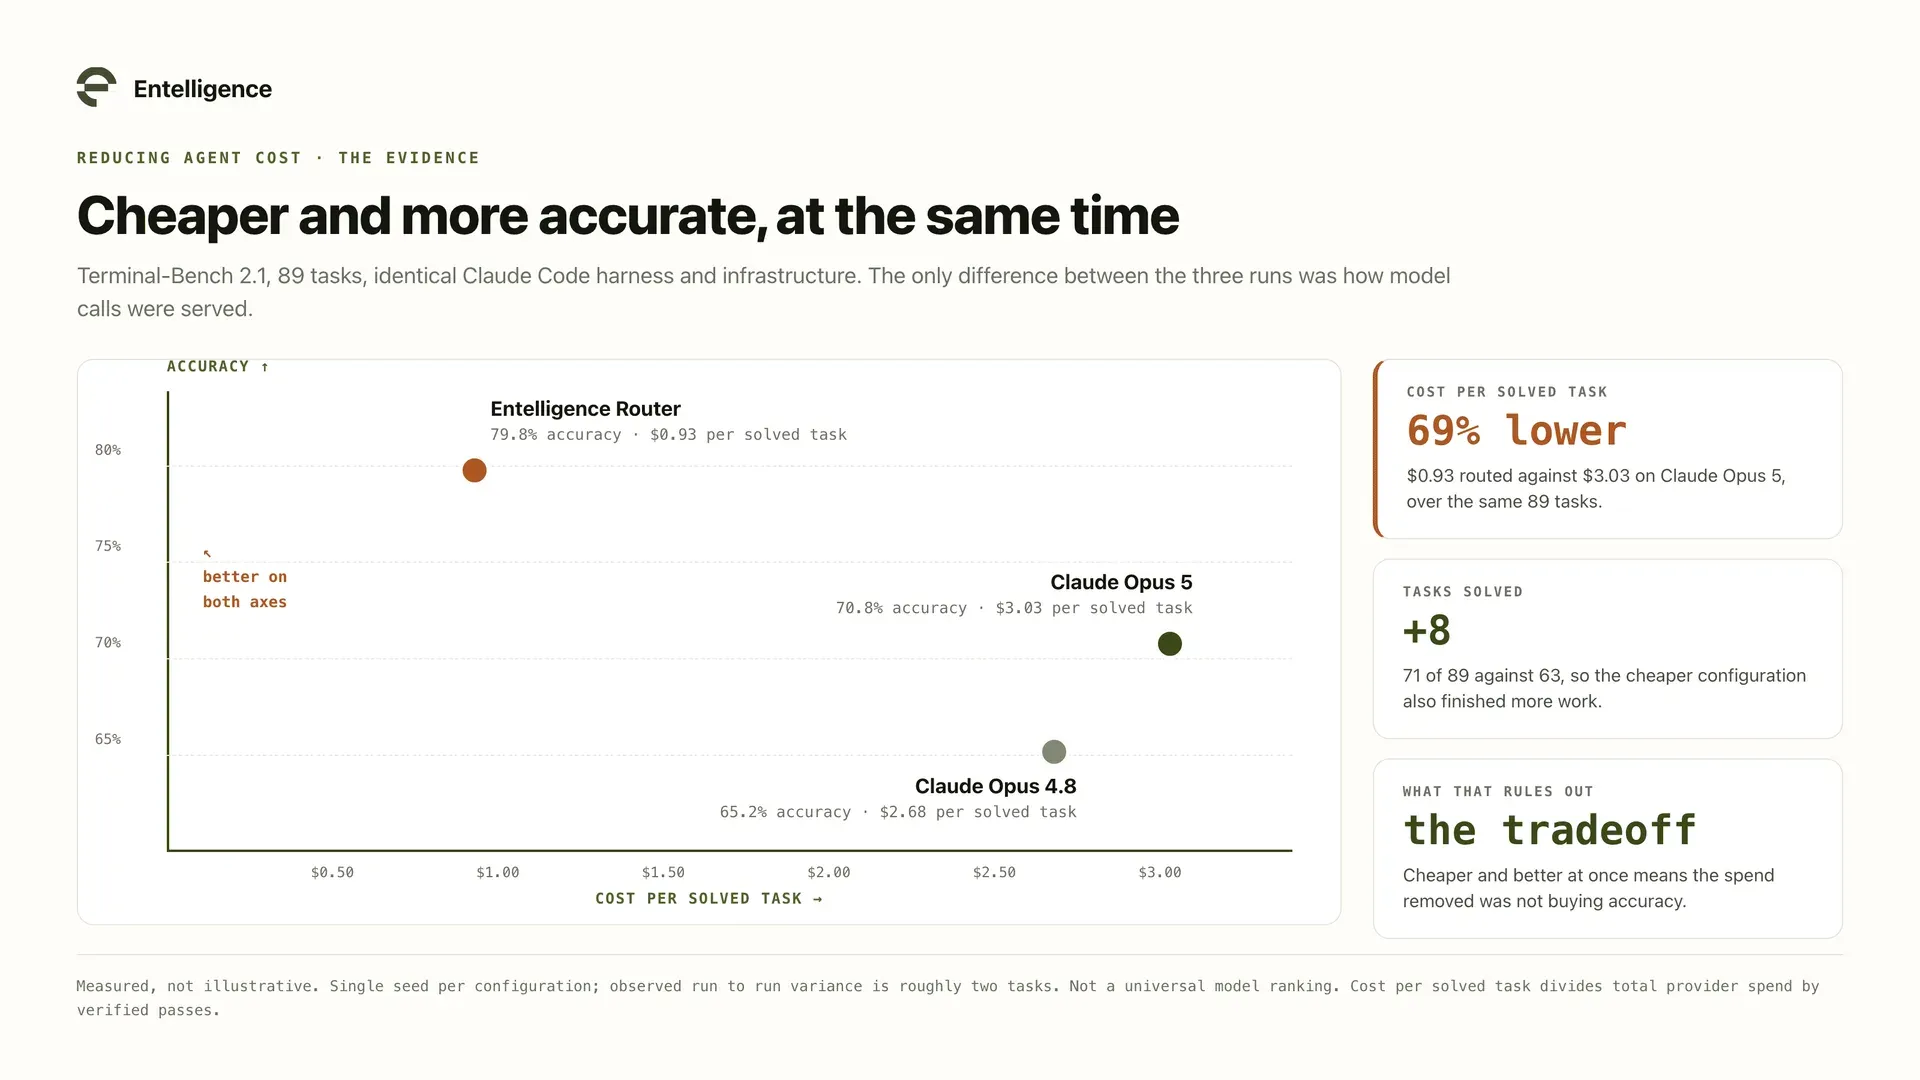
Watch for tokens rising while efficiency falls, retry hotspots in one repository, or sudden deterioration after a model change. Retries usually expose system problems: ambiguous tasks, missing permissions, unreliable tests, or tool failures. Decides what to fix around the agent, and whether a model or routing change helped, the way our 89-task Terminal-Bench comparison measured one. Never a developer-quality score: it describes the interaction among engineer, task, context, model, and tooling.
Put the five metrics into one scorecard
Metric | Frequency | Owner | Useful segmentation | Decision enabled |
|---|---|---|---|---|
AI spend by outcome | Monthly | VP Engineering / EngOps | Team, project, model | Budget allocation |
Cost per outcome | Monthly | EngOps + Finance | Team, workflow, repository | Vendor and model selection |
Productive usage vs. overhead | Weekly | Director / EM | Team, session type | Context and workflow fixes |
Capability adoption | Monthly | DevEx lead | Team, role, tenure | Training and license sizing |
Session efficiency | Weekly | EM | Task type, model, repository | Tooling and guardrail changes |
The last column is the critical one. If a metric does not change a decision, it is not yet part of the operating system.
Review at three speeds
Cadence | Who reviews | What they review | Decisions |
|---|---|---|---|
Weekly | Engineering managers and team leads | Session efficiency, retries, overhead causes, outlier sessions | Fix permissions, tests, context, and task definition before small problems become expensive habits. |
Monthly | Directors, VPs, EngOps, and DevEx | Spend by outcome, cost per outcome, budget run rate, capability adoption | Reallocate budget and plan enablement. |
Quarterly | Engineering leadership and finance | All five metrics alongside DORA and quality measures | Review renewals, routing, contracts, and the AI portfolio. |
For most AI metrics there is no credible universal benchmark. Set an internal baseline over 60 to 90 days and manage the trend.
Metrics that look useful but mislead on their own
Metric | What it actually measures | Feeds |
|---|---|---|
Total tokens | Consumption, including retries and context re-reads | Productive usage |
Total sessions | Nothing about depth, completion, or outcome | Session efficiency |
Lines of AI-generated code | Volume, which can be future maintenance rather than value | Cost per outcome |
Suggestion acceptance rate | An accepted keystroke, not whether the code merged or survived review | Capability adoption |
AI usage hours | Presence, not progress | Session efficiency |
Raw pull-request volume | A count that can be raised without raising value | Cost per outcome |
Do not discard them. The right-hand column is the point: a usable ingredient, a misleading headline.
How to build an AI insights dashboard
Perfect attribution on day one is not required.
Connect the AI sources. Usage from the coding agents and model providers your teams actually use.
Map identities, teams, repositories, and projects. Bad mapping makes every comparison downstream less trustworthy.
Set project budgets. Budgets turn spend into a managed variable with run rate and variance.
Validate outcome attribution. Check a sample of known projects before reporting categories upward.
Configure the five-metric scorecard. Give each metric an owner, cadence, and decision.
Record a baseline. Observe 60 to 90 days before treating a movement as a pattern.
Set responsible-use guardrails. Team and individual data should improve systems and coaching, never become a standalone performance score.
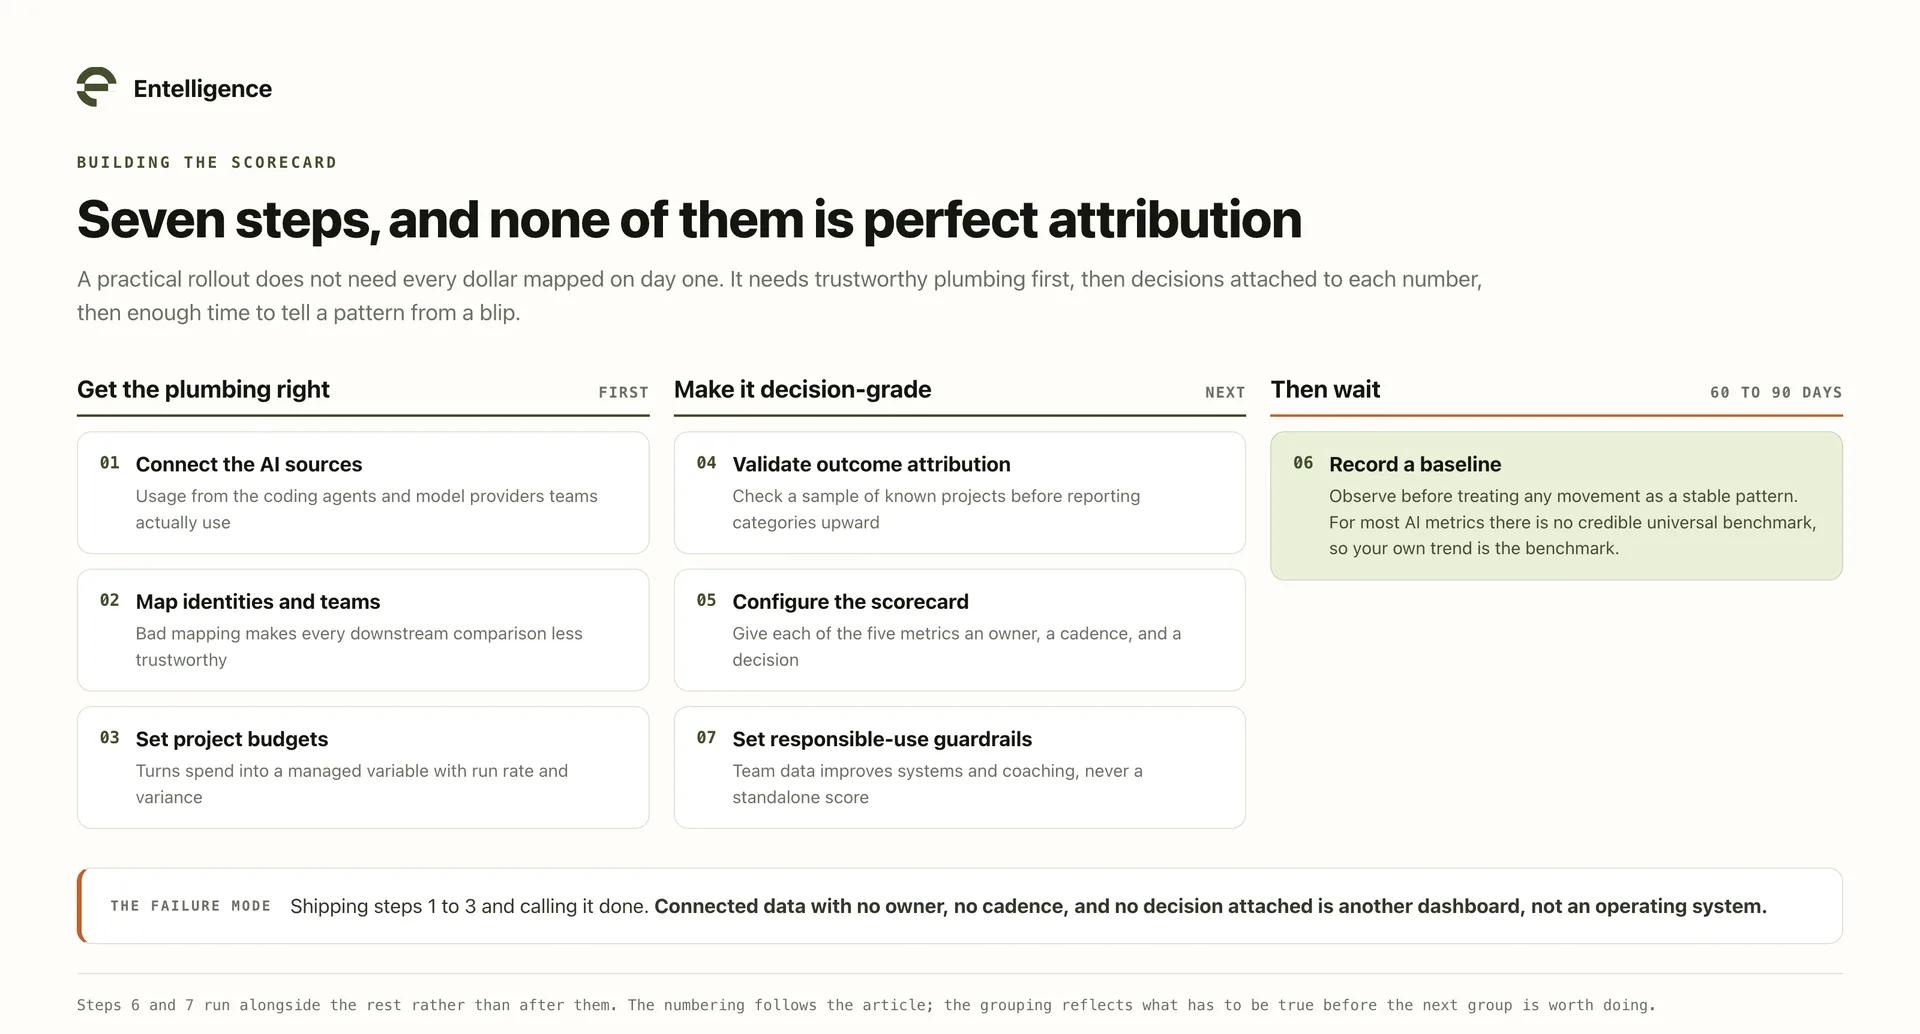
Order matters more than speed. Steps 1 to 3 are plumbing, and stopping there produces connected data nobody owns.
Entelligence Agent Insights brings spend, usage, adoption, session behavior, and outcomes together across Claude Code, Codex, and Cursor. GitHub Copilot support is listed as coming soon.
Measure what the AI investment produces
You need enough visibility to set a baseline, expose waste, and connect AI activity to outcomes.
Spend by outcome so budgets reflect what AI produces.
Cost per outcome so the investment survives a finance review.
Productive usage so activity stops impersonating progress.
Capability adoption so licenses become repeatable practice.
Session efficiency so rework is fixed at the system level.
The five are not a scoreboard. They are a control system.
Explore Entelligence Agent Insights or read the documentation.

Most AI dashboards answer the easiest question: How much did we use?
Seats, sessions, tokens, total spend. Useful for billing. Not enough to run an AI program, which needs to know where the money went, whether the usage produced work, and where sessions burn time. That takes a different scorecard:
AI spend by outcome
Cost per meaningful engineering outcome
Productive AI usage versus exploration and overhead
AI capability adoption
AI session efficiency
They sit alongside DORA and quality metrics rather than replacing them.

Why traditional engineering metrics are not enough
DORA, cycle time, throughput, and defect rates remain the backbone of engineering measurement. Keep them. They just cannot answer the AI questions:
The AI question | What a delivery metric shows instead |
|---|---|
Which tools and models consume the budget | Nothing. Spend sits outside the delivery system. |
How token and context usage changes between workflows | Cycle time, with no way to attribute the change |
Whether agent sessions make progress or repeat themselves | A merged pull request, however many attempts it took |
How deeply teams adopt agent capabilities | Throughput, which a single power user can lift |
Which engineering outcomes the AI activity supports | The outcome, with no line back to the spend |
AI also moves those metrics in opposite directions at once. The 2025 DORA report associated higher AI adoption with increased delivery throughput and increased instability. Watching only those two shows the effect without the cause.
Perception is no substitute either. In a randomized controlled trial by METR, experienced developers in mature repositories took 19% longer with AI, having predicted a 24% speedup and still believing afterward they were 20% faster.

A survey would have recorded a win here.
Metric 1: AI spend by outcome
Definition: The share of AI spend allocated to features, fixes and rework, tests and reviews, and exploration and overhead.
AI spend by outcome (%) = AI cost attributed to an outcome category / total AI cost × 100
Total spend tells you how large the bill is. This tells you what it represents. Two teams, same $30,000 a month, illustrative allocations:
Illustrative outcome split | Team 1 | Team 2 |
|---|---|---|
Features created | 55% | 20% |
Tests and reviews | 20% | 10% |
Fixes and rework | 15% | 30% |
Exploration and overhead | 10% | 40% |
Monthly AI spend | $30,000 | $30,000 |
The invoice total is identical. The management decision is not.

Entelligence research across more than 1 million pull requests and 2,444 organizations estimates that about $0.18 of each dollar spent on AI coding tools becomes shipped product. That is vendor-produced research, not a universal benchmark, but it shows why allocation matters.
Watch for unbounded exploration that never converts, or rework rising with no change in delivery. Zero exploration is not the target. Segment it, because an org-wide average hides one team spending 60% on exploration while another spends 5%. Decides where to raise, hold, or cut a budget. Agent Insights shows the allocation, including untracked spend.
Metric 2: Cost per meaningful engineering outcome
Definition: AI spend divided by a countable unit of delivered work. Start with a denominator you can measure consistently.
Cost per merged pull request = AI spend attributed to development work / AI-assisted merged pull requests
Team | AI spend | AI-assisted merged PRs | Cost per merged PR |
|---|---|---|---|
Team 1 | $9,600 | 320 | $30 |
Team 2 | $14,000 | 200 | $70 |
Those hypothetical figures do not prove Team 1 is better. The teams may work on different systems, and as Microsoft Research notes, a merged PR is not equivalent to the value it delivers. It still beats reporting 38 billion tokens.
Watch for spend rising faster than shipped work. Compare within similar work and pair it with change failure rate and PR size, so nobody improves the number by splitting work. Decides model and vendor selection: if frontier models double the cost of routine outcomes with no quality gain, the placement policy should change, which is the case for an LLM router. Upgrade the denominator toward shipped features as attribution matures.
Metric 3: Productive AI usage versus exploration and overhead
Definition: The share of usage that reaches accepted or shipped work, against usage lost to retries, repeated edits, abandoned sessions, and oversized context.
Productive usage rate = AI usage attributed to accepted or shipped work / total AI usage
Perfect attribution is hard. Start with one minus the share of tokens consumed by identifiable overhead. High consumption can look like engagement while being thrash:
Source | Finding |
|---|---|
GitClear analysis of 211 million changed lines | Code churn rose from 3.3% to 5.7% in the AI era. |
66% encounter AI solutions that are almost right but not quite; 45% say debugging AI-generated code takes more time. |
Watch for outlier sessions eating a large share of tokens, rising retries, and expensive models looping on tasks they never finish. Segment by session type, since interactive pairing and background agents have different shapes. Do not call all exploration waste: bounded prototyping that informs delivery is productive. Decides where to fix context hygiene, guardrails, or task specs before adding budget.
Metric 4: AI capability adoption
Definition: The percentage of a team actively using specific agent capabilities, not merely holding a license.
Capability adoption rate (%) = engineers who used capability X during the period / engineers with access × 100
Track each capability separately. Each signals something different:
Capability | What its adoption signals |
|---|---|
Plan mode | Engineers are directing the work instead of accepting whatever arrives |
Skills | Successful practices have been captured and shared rather than re-invented |
Current recommended models | Teams are not stranded on a model that was current last quarter |
Sub-agents | Work is being decomposed, not handed over as one large prompt |
MCP tools | Agents can reach real systems, which raises both the value and the risk |
Task tracking | Agent work is visible and reproducible after the fact |
Seat activation is the weakest possible signal. One accepted autocomplete makes a developer look active in a vendor report.

Watch for paid seats with little recurring use, an expert minority with no wider spread, or heavy autonomous-agent use without task tracking and guardrails. Decides training, license rightsizing, and which champions' practices to standardize. One caveat matters most: adoption stage is a coaching signal, not a performance score. Do not rank engineers by it.
Metric 5: AI session efficiency
Definition: How effectively a session converts context and tool use into progress, complemented by retry rate.
Retry rate (%) = retried agent actions / total agent actions × 100
Efficiency itself is usually a composite. Define yours explicitly and keep it stable, because a metric that changes meaning each quarter cannot show a trend. Two teams with identical spend and adoption can still work in very different environments:
Efficient session environment | Inefficient session environment |
|---|---|
Clear tasks | Repeated interruptions |
Reliable tests | Re-prompting |
Permissions needed to finish | Retries around missing context |
Delivery metrics surface that gap weeks later, when the workflow is no longer fresh.
Watch for tokens rising while efficiency falls, retry hotspots in one repository, or sudden deterioration after a model change. Retries usually expose system problems: ambiguous tasks, missing permissions, unreliable tests, or tool failures. Decides what to fix around the agent, and whether a model or routing change helped, the way our 89-task Terminal-Bench comparison measured one. Never a developer-quality score: it describes the interaction among engineer, task, context, model, and tooling.
Put the five metrics into one scorecard
Metric | Frequency | Owner | Useful segmentation | Decision enabled |
|---|---|---|---|---|
AI spend by outcome | Monthly | VP Engineering / EngOps | Team, project, model | Budget allocation |
Cost per outcome | Monthly | EngOps + Finance | Team, workflow, repository | Vendor and model selection |
Productive usage vs. overhead | Weekly | Director / EM | Team, session type | Context and workflow fixes |
Capability adoption | Monthly | DevEx lead | Team, role, tenure | Training and license sizing |
Session efficiency | Weekly | EM | Task type, model, repository | Tooling and guardrail changes |
The last column is the critical one. If a metric does not change a decision, it is not yet part of the operating system.
Review at three speeds
Cadence | Who reviews | What they review | Decisions |
|---|---|---|---|
Weekly | Engineering managers and team leads | Session efficiency, retries, overhead causes, outlier sessions | Fix permissions, tests, context, and task definition before small problems become expensive habits. |
Monthly | Directors, VPs, EngOps, and DevEx | Spend by outcome, cost per outcome, budget run rate, capability adoption | Reallocate budget and plan enablement. |
Quarterly | Engineering leadership and finance | All five metrics alongside DORA and quality measures | Review renewals, routing, contracts, and the AI portfolio. |
For most AI metrics there is no credible universal benchmark. Set an internal baseline over 60 to 90 days and manage the trend.
Metrics that look useful but mislead on their own
Metric | What it actually measures | Feeds |
|---|---|---|
Total tokens | Consumption, including retries and context re-reads | Productive usage |
Total sessions | Nothing about depth, completion, or outcome | Session efficiency |
Lines of AI-generated code | Volume, which can be future maintenance rather than value | Cost per outcome |
Suggestion acceptance rate | An accepted keystroke, not whether the code merged or survived review | Capability adoption |
AI usage hours | Presence, not progress | Session efficiency |
Raw pull-request volume | A count that can be raised without raising value | Cost per outcome |
Do not discard them. The right-hand column is the point: a usable ingredient, a misleading headline.
How to build an AI insights dashboard
Perfect attribution on day one is not required.
Connect the AI sources. Usage from the coding agents and model providers your teams actually use.
Map identities, teams, repositories, and projects. Bad mapping makes every comparison downstream less trustworthy.
Set project budgets. Budgets turn spend into a managed variable with run rate and variance.
Validate outcome attribution. Check a sample of known projects before reporting categories upward.
Configure the five-metric scorecard. Give each metric an owner, cadence, and decision.
Record a baseline. Observe 60 to 90 days before treating a movement as a pattern.
Set responsible-use guardrails. Team and individual data should improve systems and coaching, never become a standalone performance score.

Order matters more than speed. Steps 1 to 3 are plumbing, and stopping there produces connected data nobody owns.
Entelligence Agent Insights brings spend, usage, adoption, session behavior, and outcomes together across Claude Code, Codex, and Cursor. GitHub Copilot support is listed as coming soon.
Measure what the AI investment produces
You need enough visibility to set a baseline, expose waste, and connect AI activity to outcomes.
Spend by outcome so budgets reflect what AI produces.
Cost per outcome so the investment survives a finance review.
Productive usage so activity stops impersonating progress.
Capability adoption so licenses become repeatable practice.
Session efficiency so rework is fixed at the system level.
The five are not a scoreboard. They are a control system.
Explore Entelligence Agent Insights or read the documentation.
We raised $5M to run your Engineering team on Autopilot
Watch our launch video
Talk to Sales
Production reliability, solved.
The AI engineer that reviews every PR against your incident history, watches production, and self-heals when things break. The same class of bug will not ship twice.
Talk to Sales
Production reliability, solved.
Connect with our team to see how Entelliegnce helps engineering leaders with full visibility into sprint performance, Team insights & Product Delivery
Try Entelligence now


