How to Measure and Improve Engineering Productivity Step by Step
If you have ever questioned whether your engineering team is improving or just moving in circles, engineering productivity gives you that answer. When it is measured the right way, it does not show how busy people are. It shows whether the work is actually turning into shipped results.
Most teams track numbers that look fine on dashboards but still hide what is happening. Engineering productivity cuts through that noise. It exposes whether effort is turning into progress or just activity that looks like progress.
In this article, we will break down what engineering productivity means, how to measure it correctly, and how to improve it without guessing.
If You Only Read One Section, Read This
Most teams measure activity and then wonder why nothing improves. Only delivery-linked signals show whether work actually holds up in practice.
Late measurement creates late action. If you wait for retros or reports, you are fixing the past instead of preventing the next failure.
Productivity fails when it is treated as an audit. It must shape behavior inside the IDE, PR, and sprint while work is still moving.
The useful metrics are the ones that expose friction and rework before they spread, not the ones that report how much work was attempted.
You cannot fix what you cannot see. Productivity improves only when detection and intervention live in the workflow rather than outside it.
If that sounds like a different definition than what most dashboards show, that is because it is. To understand it clearly, you need rules that do not lie.
Engineering Productivity And The 4 Core Rules That Define It?
Engineering productivity is the ability of an engineering team to produce software that ships, runs reliably, and moves the product forward without unnecessary rework or delay. It reflects the effectiveness of the work delivered, not the amount of work attempted.
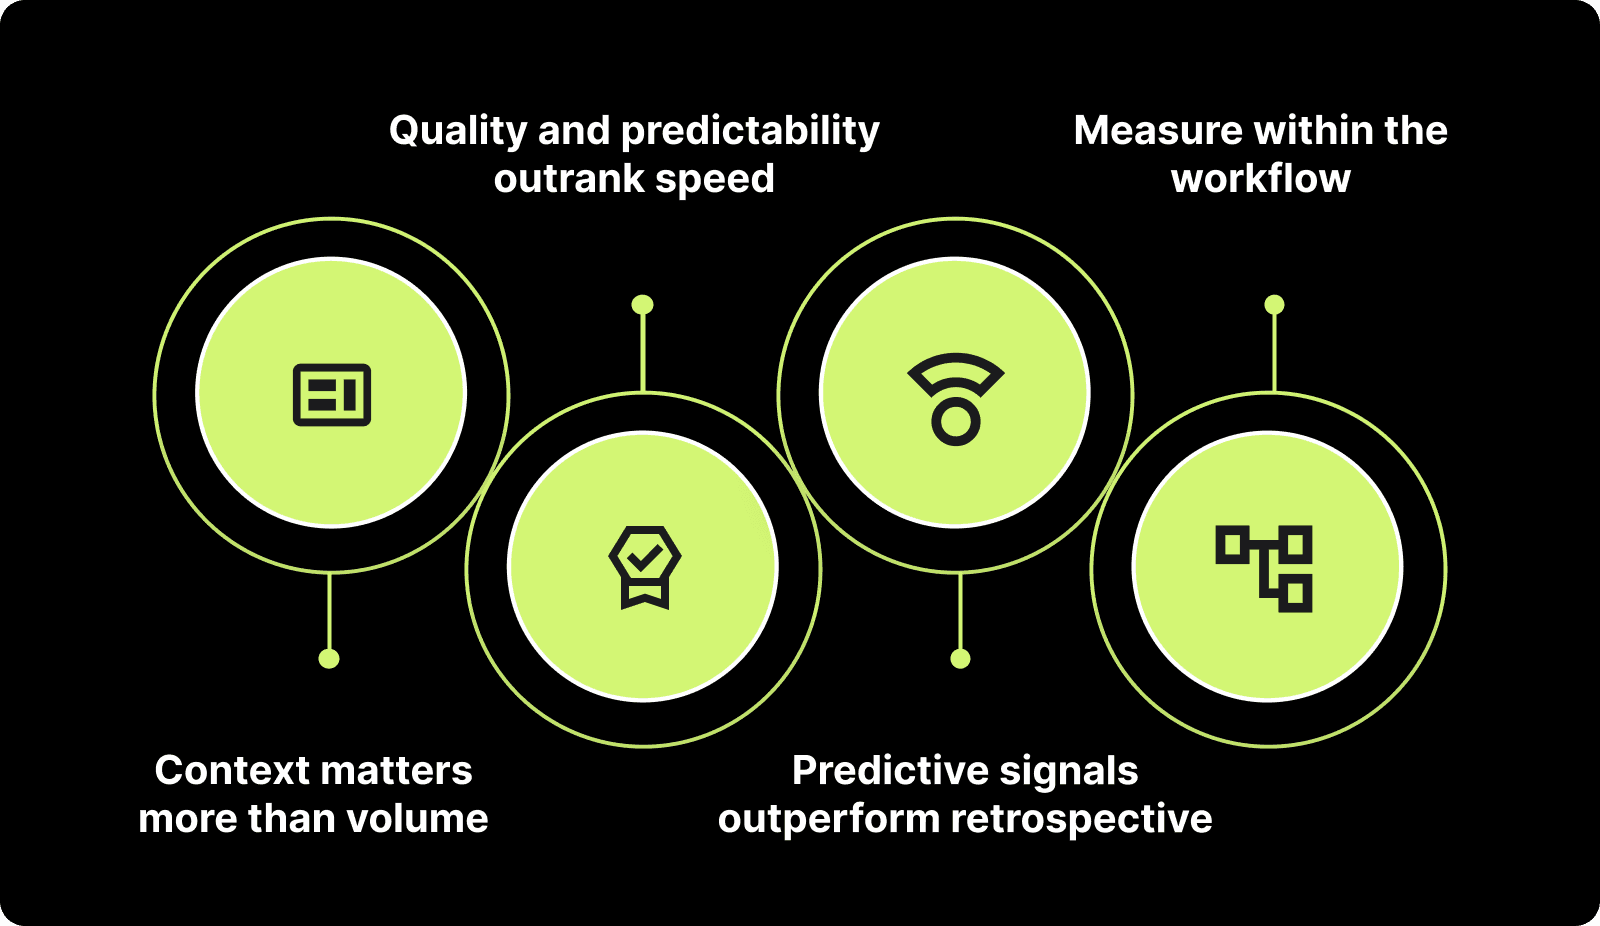
Engineering productivity is governed by four rules:
Context matters more than volume
Output that does not move the product forward is waste, even when delivered fast.Quality and predictability outrank speed
Shipping once means nothing unless the release stays up without breakage or rollback.Predictive signals are superior to retrospective signals
A problem prevented before release saves more time and cost than one fixed after impact.Measurement must live inside the workflow, not after it
If you measure when the work is already done, the damage has already compounded.
This understanding shifts engineering productivity from counting activity to evaluating whether the work actually holds up in practice.
Also Read: How Modern Engineering Teams Gain Clarity with Entelligence AI
Knowing what to measure is only half the battle. The real damage happens when it is measured in the wrong place or at the wrong time.
How to Measure Engineering Productivity Without Distorting Behavior
Measuring engineering productivity is not about producing a score. It is about shaping decisions while the work is still in motion. When measurement happens too late or in the wrong place, it produces the wrong conclusions and drives the wrong actions.
Why measuring after the sprint or release leads to weak insight
It reveals problems only after they have already caused delays, rework, or cost.
It forces teams to react instead of preventing.
It turns productivity into a summary of the past rather than a tool for improvement.
Why fragmented tools produce an incomplete view
GitHub shows code changes, Jira shows task progress, Notion holds design context, Slack holds decisions: none of them connect in one place.
Each function (developer, manager, leadership) ends up reading a different “truth”.
Teams spend time interpreting instead of improving.
What a correct measurement approach must do
It must collect signals inside the workflow, while the work is happening, not after it is done.
It must reflect context, not just counts, so the numbers actually explain behavior.
It must be neutral and consistent, so it informs decisions rather than shaping reports.
Once the measurement approach is correct, the choice of metrics becomes meaningful. Tools like Entelligence help collect these signals within the workflow rather than after the fact, so the measurement reflects reality.
Also Read: Top 8 Developer Productivity Tools For Maximum Efficiency
Now that you know where teams go wrong when measuring, the question becomes: which signals are worth paying attention to?
10 Engineering Productivity Metrics Worth Tracking for Engineering Leaders
Tracking the right engineering productivity metrics helps leaders understand how work is moving through the system, where delays originate, and how delivery quality holds over time. The goal is to monitor signals that reflect progress, not just motion.
1) DORA Metrics (Deployment Frequency, Lead Time, Change Failure Rate, MTTR)
Deployment Frequency shows how often teams ship usable code.
Lead Time shows how long changes take from commit to production.
Change Failure Rate shows how often deployments cause issues.
Mean Time to Restore shows how quickly failures are resolved.
Together, these four signals provide a high-level view of speed, stability, and reliability of delivery. Platforms such as Entelligence surface these signals without manual stitching across tools.
2) PR Review Time / PR Idle Time
Measures how long pull requests wait before being reviewed or merged.
Long idle time indicates either reviewer overload or unclear ownership.
Faster reviews reduce context loss and help teams ship without backlogs forming.
Also Read: Exploring PR Review AI Tools: Boost Code Quality Fast
3) Rework Rate / % of Work Done Twice
Tracks how often completed work must be redone, revised, or reversed.
A high rework rate signals unclear requirements, weak reviews, or rushed coding.
Reducing rework directly improves engineering capacity without hiring more people.
4) Work in Progress (WIP)
Shows how many tasks are being worked on at the same time.
High WIP increases context switching and slows down completion of anything.
Keeping WIP controlled improves focus and predictability.
5) Escaped Defects / Production Bugs
Counts defects that reach end users instead of being caught earlier.
High numbers reflect gaps in testing, reviews, or system understanding.
Lower escaped defects signal stronger quality control throughout the pipeline.
Also Read: Introducing Entelligence Deep Review Agent
6) Planning Accuracy (Commit vs Complete without spillover)
Compares what teams planned to complete versus what they actually finished.
Low accuracy means leaders are making decisions using unreliable forecasts.
Improving this metric stabilizes expectations across engineering and product.
7) Merge Frequency
Measures how often code is integrated into the main branch.
Higher merge frequency captures smoother collaboration and shorter feedback cycles.
Slow merging usually indicates bottlenecks in review or build processes.
8) Flow Efficiency
Shows the ratio of time spent actively working versus waiting.
Low flow efficiency means work waits more than it moves.
Improving flow efficiency increases delivery speed without adding headcount.

9) Incident Volume Linked to Code Changes
Tracks production incidents connected to recent deployments or refactors.
Helps identify high-risk areas in code or recurring failure patterns.
Lower incident volume reduces firefighting and preserves development time.
10) Stability of Delivered Output Over Time (Rollback / Hotfix Trend)
Measures how often released code must be rolled back or patched after shipping.
Frequent fixes show that work is leaving the pipeline before it is ready.
Stability over time signals that productivity improvements are real, not cosmetic.
A platform like Entelligence can surface these signals automatically so leaders do not infer from fragmented tools.
Also Read: How to Measure Developer Productivity Effectively
Knowing what to track is only half the story. The real test is whether those signals show delivery holding up or collapsing on the way out.
12 Engineering Productivity Metrics That Directly Impact Delivery
You do not improve delivery speed or stability by looking at activity. You improve it by tracking where work slows, breaks, and returns for rework. The metrics below help you see if code is actually on a path to a clean release or silently accumulating risk. These are outcome-level signals, not planning or perception metrics.
1) Lead Time to Merge After Approval
Measures the delay between approval and merge
Long delays create delivery drift even when the work itself is done
Teams use this to enforce ownership for the post-approval phase instead of letting approved work age unnoticed
2) Blocked Work Duration
Captures how long a task sits blocked before someone takes action
Silent blocks are one of the main reasons for late deliveries
Tracking this forces earlier intervention instead of discovering blockages during retros
3) Rollbacks per Release Window
Shows how often releases must be reversed
Frequent rollbacks indicate code is entering production before it is stable
Teams monitor this to tighten validation gates and adjust release criteria
4) Hotfix Rate Within 7 Days of Release
Counts urgent fixes immediately after deployment
A high rate means delivery happened at the cost of stability
Teams use this to separate release approval from internal delivery deadlines
5) Reopened Tickets After Marked “Done”
Tracks how often finished work returns for correction
Reopened work consumes capacity and hides delivery instability inside closed tickets
Monitoring this forces clearer acceptance standards at the point of completion
6) Test Failure Rate in CI Pipeline
Shows the proportion of failed checks before release
High rates slow delivery and reduce confidence in shipping decisions
Teams treat this as a prerequisite signal before attempting to accelerate releases
7) Flaky Test Frequency
Counts tests that pass and fail inconsistently
Flaky tests create false confidence and trigger unnecessary rework
Teams remove or fix them to restore trust in the pipeline as a decision system
8) Spillover to Next Sprint
Captures how many planned items move forward unfinished
Spillover indicates that delivery is harder to predict than reported
Reviewing this forces recalibration of commitment and reduces artificial optimism
9) Untriaged Bug Backlog Size
Counts bugs that exist but have not been reviewed or prioritized
Untriaged bugs represent unquantified risk that can surface late in the cycle
Regular triage prevents hidden risk from collapsing schedules later
10) Manual Intervention During Deployment
Tracks how many releases require human steps
Manual steps slow delivery and add failure risk
Teams use this to build a case for automating the steps that most often cause pause or error
11) Dependency Wait Time
Measures time lost waiting on other teams, APIs, or services
Delivery slips even when internal work is complete if dependencies stall
Tracking this exposes where boundaries or ownership create recurring friction
12) Security Findings Left Unresolved Before Release
Counts known security issues that ship instead of getting fixed
Shipping with unresolved findings increases cost and risk after launch
Teams use this metric to set thresholds that block unsafe releases before they exit the pipeline
You can measure all the right things and still make no dent in delivery if you try to fix the wrong layer or fix too late.
3 Root Causes Why Attempts to Improve Engineering Productivity Fail
You cannot raise engineering productivity by adjusting reports or pushing teams harder. Most failed attempts come from solving at the wrong layer or at the wrong moment. The three patterns below create the illusion of improvement while locking the real problems in place.
1) You fix issues late in retros instead of fixing them inside the flow
Retros surface problems only after the sprint is already closed and the damage is irreversible
Teams leave with action items that do not change the next sprint’s active work in real time
This creates a pattern where you record problems instead of preventing them
Teams move into the next sprint carrying the same friction under a new label
2) You optimize a single team in isolation and introduce new friction across other teams
Local improvements break down when the team depends on another team that runs differently
A team can improve cycle time or reviews while still blocking downstream work due to incompatible pacing
The result looks like a win inside one boundary but increases wait time and risk elsewhere
Leaders read local gains as progress while the system gets slower
3) You treat productivity as an audit instead of an in-flow intervention
Metrics are viewed as reports to discuss rather than signals to act on while work is still moving
Engineers adjust behavior to make metrics look stable instead of making delivery stable
This moves productivity into a compliance exercise and freezes actual improvement
Reporting improves while delivery patterns remain unchanged
Diagnosis alone does nothing. The fix works only when it is inserted inside the flow where delivery risk is created, not after it lands in a retro.
Proven Interventions to Improve Engineering Productivity Without Guesswork
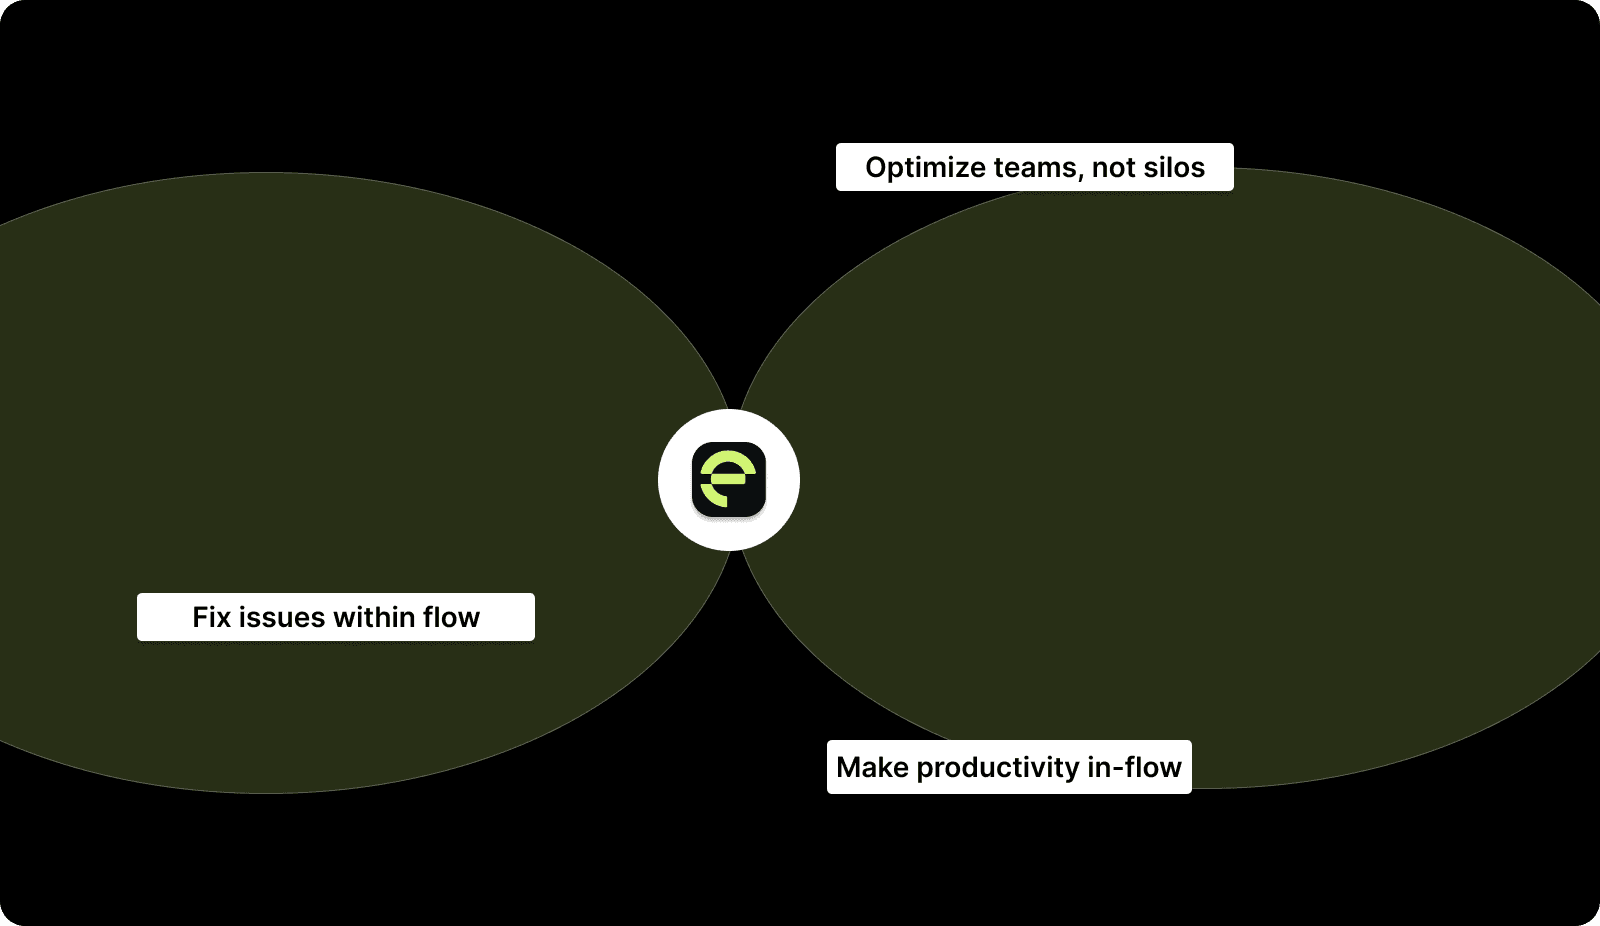
You do not improve engineering productivity by pushing people or rewriting process docs. You improve it by removing the points where work stalls, reopens, or derails delivery. Each of the interventions below fixes one of the root causes described earlier and works inside the flow, not after the damage is recorded.
1. Move defect detection into the IDE instead of waiting for retros or QA
Acts at: IDE stage
Pain removed: Rework caused by issues discovered after code is already merged or deployed
Teams that catch errors before PR submission avoid review loops, retests, and reopened tickets
2. Set PR review time limits and enforce reviewer ownership inside the PR stage
Acts at: PR stage
Pain removed: Idle PRs that silently delay releases and pile up unfinished work
Assigning a single accountable reviewer prevents requests from aging without action
3. Block releases that contain unresolved security or production-risk findings
Acts at: release gate
Pain removed: Hotfixes and rollbacks caused by shipping known issues
A release should not continue if it introduces debt that will return as failure
4. Cap Work In Progress (WIP) inside the sprint instead of inspecting it after
Acts at: sprint execution
Pain removed: Slowed delivery from context switching and unfinished spillover
Lower WIP concentrates effort and brings tasks to completion faster
5. Review reopened tickets weekly instead of only in retros
Acts at: post-completion stage before close
Pain removed: False “done” status that hides instability and burns capacity later
Teams that inspect reopen causes correct standards before the next sprint begins
6. Track and intervene on blocked work in real time, not at sprint-end
Acts at: mid-sprint in-flight work
Pain removed: Slipped delivery caused by silent blockers left unresolved
Escalation during the sprint prevents rework from stacking up against deadlines
7. Automate deploy steps where manual input creates delay or risk
Acts at: deployment step
Pain removed: Failed or slow releases due to manual operations
Removing human intervention stabilizes both speed and repeatability of shipping
8. Tie planning capacity to historic completion instead of subjective commitment
Acts at: planning stage
Pain removed: Chronic spillover and inaccurate delivery promises
Plans that reflect real output produce stable expectations and cleaner sprint exits
9. Unify engineering signals into a single source instead of stitching reports post-hoc
Acts at: leader decision layer
Pain removed: Misalignment from fragmented data and post-hoc interpretation
Leaders decide on current data, not on narratives built after the sprint closes
You now know what to fix and where to fix it. Entelligence is built to do that fixing in the only place that matters: inside the work while it is still moving.
The Entelligence Approach to Engineering Productivity
Most attempts to improve productivity act after the damage is already locked in. By the time a retro or a weekly report surfaces the problem, the sprint is closed, capacity is burnt, and the cost has already propagated forward. We built Entelligence to act at the point where productivity is actually decided; inside the work, not after it.
We intervene at the same failure points most teams struggle with:
If rework is discovered late we surface risky code inside the IDE so issues are corrected before they enter review or merge
If PRs sit idle: we detect unowned or stalled reviews and bring them to attention before they delay releases
If defects are caught after release: our background agents detect risk patterns during development so fixes do not depend on QA or production failures
If context is scattered across tools: we unify delivery, review, and stability signals so you are not stitching GitHub, Jira, Slack, and dashboards
If productivity is treated as an audit: we push actionable signals while the sprint is still in motion so behavior changes before deadlines collapse
We do not add another report on top of the problem. We change what happens where the problem is created: in the IDE, in code review, and inside the sprint.
Where the Background Agents Fit Inside This Logic
Background agents operate in the places where teams normally react too late:
Observability Agent: plugs into repos and infra to expose logging, alerting, and metrics gaps before incidents form
Design Doc Agent: extracts context and drafts architecture docs earlier, preventing rework from unclear intent
Incident Agent: correlates failures with code and config changes in real time so RCA is generated while context is still fresh
In practice, Entelligence AI transforms engineering productivity from a backward-looking report into a real-time control system that shapes how code is written, reviewed, and shipped.
How to Get Started If You’re Currently on GitHub + Jira + Retros
You do not need to rebuild your stack. You need to change where you look and when you act. Use the four-step starting sequence below.
Stop tracking vanity metrics and activity counts. Focus only on signals that affect delivery and stability.
Instrument signals tied to flow, quality, and predictability instead of volume or effort.
Move interventions into the work. Fix issues at IDE and PR stage instead of waiting for retros.
Consolidate visibility so decisions are based on one truth instead of inference from multiple tools.
At Entelligence, we compress steps two, three, and four into a single system that runs inside the workflow.
Conclusion
Improving engineering productivity requires more than post-sprint reports or vanity metrics. You only get meaningful gains when you measure inside the workflow and intervene before issues become delays, rework, or hotfixes. Shifting from after-the-fact reporting to in-flow correction is what creates repeatable delivery and stable outcomes.
If you are ready to make that shift, Entelligence gives you one system to measure what matters and act before it is too late. Why not see it in action? Start your 14-day free trial today and experience the difference.
FAQs
Q: How do I know if our team is “busy” or actually moving code toward release?
A: Look at how much work reaches a shippable state without reopening or post-release fixes. If a large portion of the work needs correction later, the activity was motion, not delivery. Track spillover, reopened tickets, and hotfix volume together to see whether your “busyness” is producing stable, releasable code.
Q: What should I do when PRs are aging even though developers say work is “done”?
A: Treat the wait as a delivery risk, not a queue. Assign explicit review ownership and time bounds so the merge path is managed, not assumed.
Q: How can I reduce firefighting without slowing feature work?
A: surface risk signals while code is still being written instead of handling issues after they reach QA or production. Prevention costs less than recovery.
Q: What is the first thing to stop doing if productivity changes are not sticking?
A: Stop inspecting after the work is finished and start intervening during active work. Post-fact discussions do not change current execution.