What are the Agile Software Development Metrics?
In Agile software development, teams are expected to move quickly, adapt to changing requirements, and deliver high-quality products. However, without clear insight into performance, teams get lost in what’s working well and what’s slowing them down.
Without solid Agile metrics, these questions remain unanswered, leading to inefficiencies and reduced customer satisfaction. In fact, 86% of teams cite inefficient communication and lack of metrics as key obstacles to achieving their goals.
The right Agile metrics help answer the hard questions and highlight where improvements are needed.
In this article, we’ll break down the most essential Agile software development metrics and explain how they can improve your development process.
Quick Glance
Agile metrics promote transparency and collaboration, ensuring all team members are aligned and informed about the team's progress.
Using metrics such as velocity, burndown charts, and lead time helps teams predict delivery timelines, set achievable goals, and avoid overcommitment.
Tracking metrics such as escaped defects ensures early issue detection and helps maintain high-quality code delivery.
For 86% of teams, the barrier is systemic, ineffective communication, and the absence of clear metrics to guide their efforts.
Aligning metrics with business goals ensures that development efforts contribute to broader organizational objectives.
What are Agile Software Development Metrics?
At their core, Agile metrics are quantifiable data points that give teams a clear picture of their progress throughout the development process. So, your teams can track how well they are delivering value, meeting deadlines, and continuously improving their processes.
Key Characteristics of Agile Metrics:
Real-Time Data: Agile metrics are collected and updated regularly to provide immediate feedback, not just at the end of a project.
Team-Centric: These metrics emphasize collaboration and efficiency rather than individual performance.
Adaptable: As Agile development is iterative, metrics should grow as teams mature and improve their processes.
For example, metrics like cycle time track the speed of work completion. On the other hand, the escaped defects metric focuses on the quality of the work being delivered.
Shifting from simply collecting data to deriving meaningful insights is what leads to genuine process improvement. We'll now detail how the strategic use of Agile metrics delivers tangible benefits that focus on key business outcomes.
Also Read: Top 8 Developer Productivity Tools For Maximum Efficiency
5 Benefits of Using Agile Metrics Your Team Can't Afford to Miss
While understanding what Agile metrics are, it’s even more crucial to recognize why you should use them. Agile metrics deliver high-quality products at a consistent pace. But is that all?
No. So, let’s break down the key advantages of using Agile metrics in your workflow:
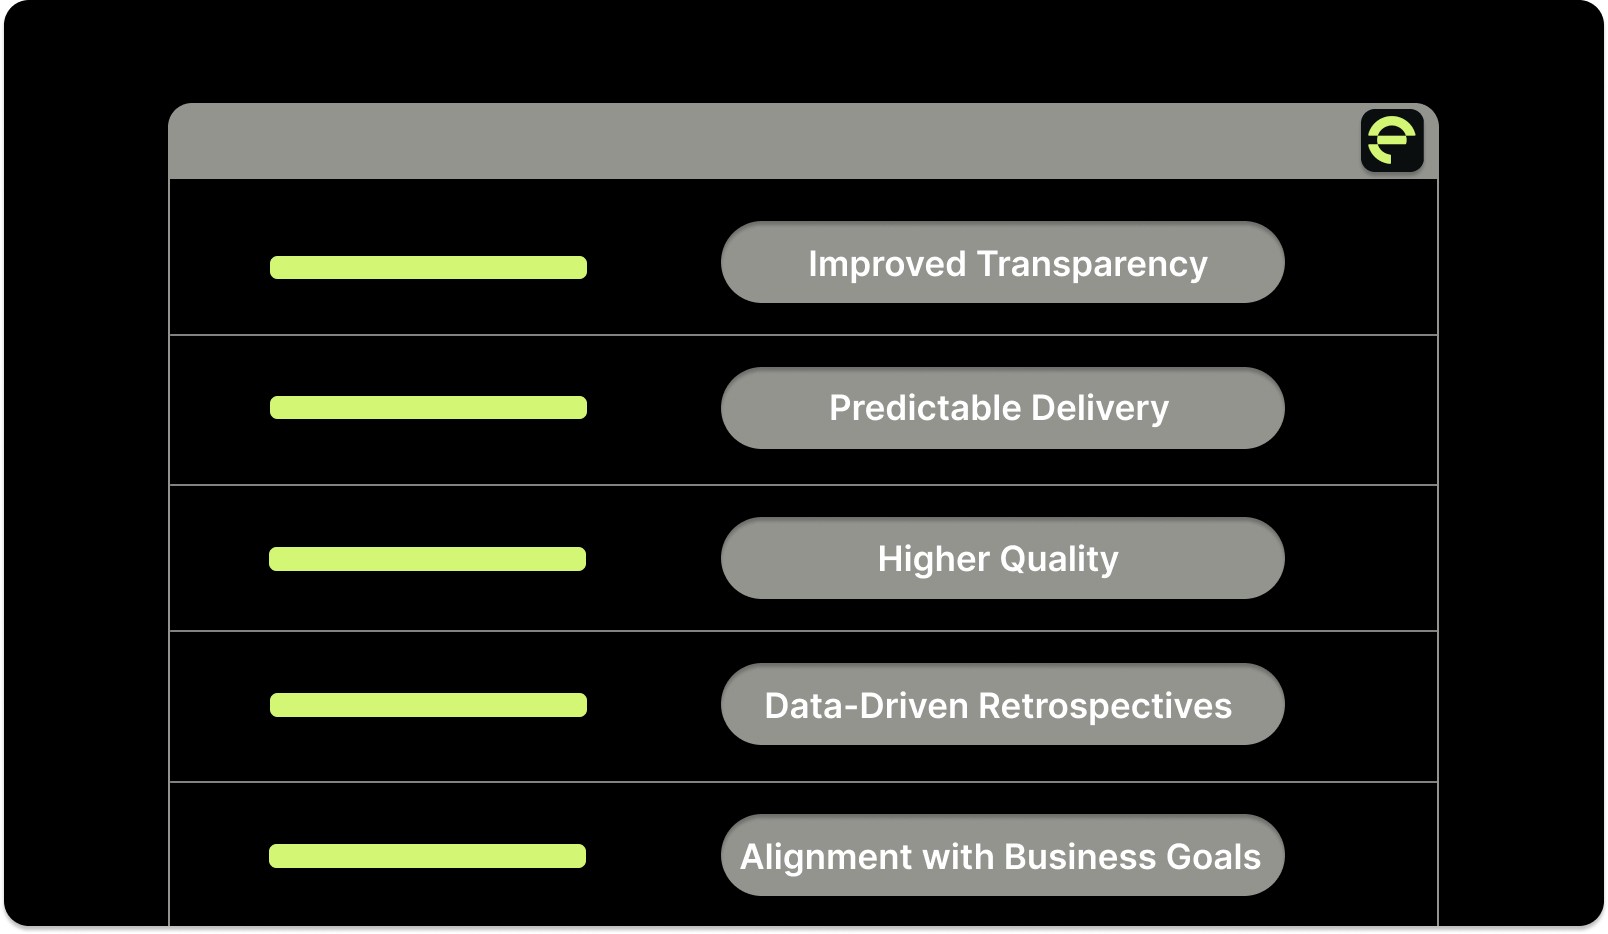
1. Improved Transparency
Agile metrics give teams clear, real-time visibility into their work, enabling everyone to understand where the team is in the development process.
Without transparency, teams are left guessing about progress or might miss important signs of delays and inefficiencies.
2. Predictable Delivery
Predicting when a feature will be delivered or when the team can commit to the next sprint can be challenging. Important agile metrics make this easier by allowing teams to understand their capacity and plan with realistic expectations.
Using data to inform planning helps teams set more achievable goals and avoid overcommitting.
3. Higher Quality
Tracking metrics for defects, such as escaped defects (bugs found post-release), helps teams spot quality issues early.
Early detection of defects leads to quicker resolution and reduces the risk of problems compounding in later stages of development.
4. Data-Driven Retrospectives
Agile retrospectives are meant to help teams reflect on their performance and improve. However, they can sometimes be subjective or based on individual opinions.
When retrospectives are based on solid data, teams can identify true process challenges rather than rely on guesswork. This results in more effective improvements, clearer action plans, and ultimately, better performance.
5. Alignment with Business Goals
Agile metrics, along with engineering metrics, help align engineering efforts with broader business objectives.
By tracking these metrics, teams can pinpoint areas for improvement, accelerate delivery, and enhance the overall quality of their work. But how do you decide which metrics matter the most to your team?
The answer depends on your methodology: Scrum, Kanban, or Lean. What are those? We'll find that out in the next section.
Also Read: AI Code Review Techniques and Top Tools
3 Types of Agile Metrics (By Framework)
Your choice of Agile framework, be it Scrum, Kanban, or Lean, determines the most relevant metrics for your team. These customized measurements provide unique insights into progress and areas for improvement.
Here, we’ll compare the key metrics for each framework and illustrate how they address distinct operational needs:
1. Scrum Metrics
Scrum metrics are essential for teams that prioritize delivering value to customers quickly, efficiently, and at a high quality.
Sprint Burndown Chart
This visually tracks the amount of work remaining in the sprint against the time left to complete it. It provides real-time insights into whether the team is on track to complete the sprint goals.
How to Measure:
Plot the remaining work (in story points, hours, or tasks) on a graph over the sprint duration (usually updated daily). A successful sprint should show a steady decline toward zero at the end of the sprint.
If the chart levels out or increases, it indicates insufficient progress, prompting timely adjustments.
Velocity
The amount of work a team completes in a sprint, typically in story points or tasks. It reflects the team's capacity for work and helps forecast future sprint commitments.
How to Measure:
Sum the story points or tasks completed during the sprint. Average velocity over several sprints to get a reliable estimate of team capacity for future sprints.
Velocity helps teams predict how much work they can realistically take on in future sprints.
Escaped Defects
The number of issues or bugs found after the sprint has been completed and the product is released into production.
How to Measure:
Count the number of defects discovered post-sprint and categorize them by severity. Tracking this over multiple sprints can help gauge the quality of the work being delivered.
High escaped defects can indicate gaps in testing or a lack of thorough review during development.
Entelligence AI enhances the code review process by providing context-aware feedback, ensuring that code meets quality standards before it reaches production.
2. Lean Metrics
Lean metrics focus on eliminating waste and improving the efficiency of the development process. These metrics help teams identify inefficiencies, reduce delays, and maintain a smoother flow of work.
Lead Time
The total time it takes for a work item to move from the initial request or backlog entry to its final delivery. This also includes all stages, backlog, development, review, and deployment.
How to Measure:
Track the time when the work item enters the backlog and when it is delivered to the customer (or marked as done in the project management tool).
The lead time for each task is calculated by subtracting the task’s start date (when it enters the workflow) from its completion date (when it’s delivered).
Reducing lead time is critical for improving agility and responsiveness.
Cycle Time
The time it takes for a task to move from "in progress" to "done." It measures the actual time spent on the task itself, excluding waiting or idle time.
How to Measure:
Track the time it takes for each task to be completed once work begins (from "in progress" to "done").
Measure the cycle time for each work item, then calculate the average cycle time for the sprint or iteration.
Shorter cycle times indicate a more efficient process, in which tasks are completed quickly and moved through the pipeline. Long cycle times can indicate bottlenecks or inefficiencies in the process.
Throughput
The number of work items (e.g., user stories, bugs, tasks) that are completed within a specific period.
How to Measure:
Count how many tasks are completed during a defined time window (e.g., per sprint or per week).
For example, if 10 tasks are completed in one week, the throughput rate for that week is 10 tasks.
Throughput reflects the team’s capacity to deliver work. Consistently tracking throughput helps teams plan future work more effectively.
Flow Efficiency
The percentage of time spent actively working on a task compared to the total time the task spends in the system.
How to Measure:
Calculate the active work time by subtracting waiting time (e.g., time spent in the backlog, in review, etc.) from the total time the task spends in the process.
Formula: Flow Efficiency = Active Time ÷ Total Time.
For example, if a task spends 5 days in the system but 3 days are idle (waiting for review or feedback), the active time is 2 days. Flow efficiency would be 2/5 = 40%.
High flow efficiency indicates that work is moving smoothly through the process without much idle time. Low flow efficiency may point to excessive delays or waiting times at specific stages.
In many engineering teams, inefficiencies and wasted time in the development process lead to longer cycle times and lead times. Teams often struggle with managing manual, repetitive tasks.

Entelligence AI enhances Lean metrics by automating repetitive tasks, including security checks and documentation. The platform provides real-time progress insights and context-aware feedback, enabling teams to reduce delays across their pipeline.
3. Kanban Metrics
Kanban metrics focus on visualizing work, limiting work in progress (WIP), and ensuring a smooth flow of tasks from start to finish. Kanban is ideal for teams that want to maintain a continuous flow of work and avoid overloading any part of the process.
Work-in-Progress (WIP)
The number of tasks or work items that are currently in progress at any given time in the workflow.
How to Measure:
Count the number of tasks that are actively being worked on across various stages (e.g., in progress, in review, or in testing). This can be measured at different workflow stages on a Kanban board.
Limiting WIP ensures that teams focus on completing tasks rather than starting new ones before finishing the current ones.
Cumulative Flow Diagram (CFD)
The number of tasks in each stage of the workflow (e.g., backlog, in progress, completed) over time.
How to Measure:
Plot the number of tasks in each workflow state over time on a graph.
This chart visually shows how work is progressing through the system and helps identify stages where work is accumulating or forming a backlog.
The CFD is valuable for spotting bottlenecks in the process. For example, if the “in progress” section of the graph widens significantly, it may indicate a bottleneck in the development process.
While Scrum, Kanban, and Lean metrics provide vital diagnostic information, their true power lies in their focus on actionable goals. The bridge between data and improvement is built with effective Key Performance Indicators (KPIs).
Read Also: Comprehensive Guide to Secure Code Review Practices
How to Set Agile KPIs?
The goal of an Agile KPI is improvement. To move beyond vanity metrics, you need indicators that connect team performance to tangible business value.
Here’s how you can do it:
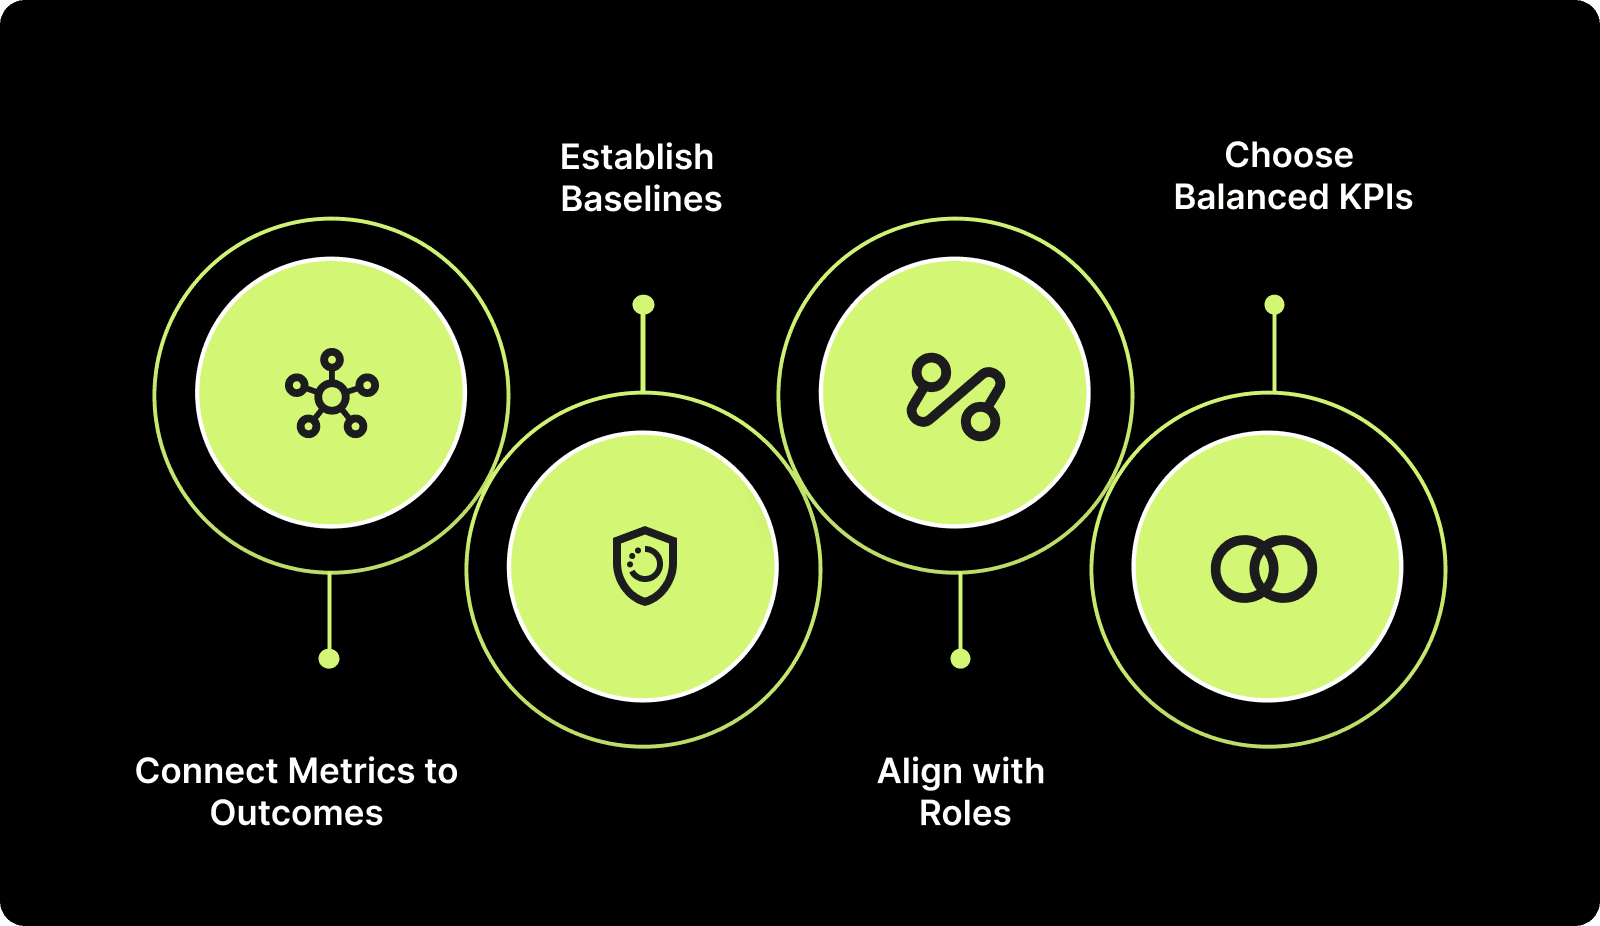
Step 1: Connect Metrics to Outcomes
Start by defining what success looks like for your team and organization.
Faster Delivery: Metrics like cycle time and lead time help you assess how quickly work moves through the system.
Higher Quality: Track metrics such as escaped defects to ensure the work meets quality standards.
Better Predictability: Use velocity and sprint burndown to forecast future sprint capacity and progress.
Step 2: Establish Baselines
Before setting targets, you need data to inform your decisions.
Collect 3–4 sprints of data to establish current averages for key metrics.
Establishing a baseline gives you a clear picture of where you are and allows you to set realistic targets for future performance.
Step 3: Align with Roles
Different roles within the team will benefit from different KPIs.
Developers: Focus on quality and flow metrics, such as cycle time, to ensure smooth development and high-quality outputs.
Managers: Prioritize predictability metrics, such as velocity, to enhance sprint planning and progress forecasting.
Leaders: Use value metrics such as delivery frequency to measure business impact and long-term strategic alignment.
Step 4: Choose Balanced KPIs
Don’t just focus on one aspect (e.g., speed or volume).
Avoid vanity metrics like sheer output numbers or overemphasis on velocity alone.
Blend speed, quality, and value KPIs for a more holistic view of team performance and business success. For example, balance lead time with escaped defects to ensure you’re not sacrificing quality for speed.
By following these steps, you can ensure your Agile KPIs align with your team’s goals and drive meaningful improvements. These KPIs will guide your team towards clear objectives, while focusing on continuous adaptation and growth.
Also Read: How to Measure Developer Productivity Effectively
How Entelligence AI Helps with Agile Metrics and KPIs?

Entelligence AI helps teams track and optimize Agile KPIs. Automating data collection and providing real-time insights removes manual overhead.
It also ensures your team can focus on improving velocity, quality, and predictability.
Key Features of Entelligence AI:
Automated Code Reviews: Automates code reviews in real-time, ensuring high-quality code before deployment, which reduces escaped defects and review time.
Real-Time Performance Insights: Provides continuous, real-time performance tracking, helping teams optimize velocity and cycle time with actionable data.
Automated Sprint Assessments: Automatically generate sprint retrospectives and health checks based on real data, providing insights into bottlenecks and progress.
Context-Aware KPIs: Tracks custom, context-specific KPIs that align with your team’s goals, improving focus on the most impactful metrics.
Integrated Dashboards: Combines key Agile metrics like velocity, defect trends, and cycle time into easy-to-read, real-time dashboards for better decision-making.
In many Agile teams, key metrics are negatively affected by manual processes and limited visibility. For example, lagging documentation can create significant challenges, reducing overall throughput.
Sybill automating Entelligence AI with manual processes, like PR reviews, can significantly improve cycle time and throughput. Reducing the median PR turnaround from 5 hours 12 minutes to 1 hour 47 minutes, Sybill’s team cut down on delays, allowing them to ship features faster and more efficiently.
In many Agile teams, key metrics are dragged down by manual processes and limited visibility. For example, lagging documentation and slow PR reviews can quietly erode throughput.
By automating manual processes like PR reviews with Entelligence AI, Sybill reduced median PR turnaround from 5 hours 12 minutes to 1 hour 47 minutes and reclaimed around 350 engineer hours for new feature development, dramatically improving cycle time and delivery speed.
Conclusion
In this article, we’ve explored how to set Agile software development metrics that align with your team’s goals and provide actionable insights for continuous improvement. We’ve discussed the importance of connecting metrics to outcomes, selecting balanced KPIs, avoiding KPI overload, and ensuring clear ownership of each metric.
Entelligence AI is designed to help teams measure and improve their performance by automating and optimizing their KPI tracking. It allows you to focus on what truly matters, delivering value quickly and efficiently.
Start using a 14-day Free Trial with Entelligence AI to automate your Agile metrics tracking and achieve your team’s goals faster and smarter.
FAQs
1. What is the difference between Agile metrics and KPIs?
Agile metrics track the progress and efficiency of a team’s workflow, such as Velocity or Cycle time. On the other hand, KPIs are specific, measurable indicators tied to broader business goals, like customer satisfaction or delivery frequency.
KPIs are typically linked to strategic objectives and help teams focus on achieving those outcomes.
2. How often should I review Agile KPIs?
The frequency of reviewing Agile KPIs depends on the metric's nature. For example, Cycle time and Velocity might be tracked daily or weekly, while customer satisfaction or product value delivery may be assessed quarterly.
Regular reviews ensure the team stays aligned with goals and can adjust quickly to any changes.
3. What are some common mistakes when setting Agile KPIs?
Common mistakes include setting too many KPIs, which can overwhelm the team, and focusing too heavily on vanity metrics (such as speed) without considering quality.
It’s essential to select a balanced mix of KPIs that provide a comprehensive view of performance and focus on actionable outcomes.