


Top 10 Engineering Metrics to Track in 2025
Are you maximizing your potential as an engineer, or just chasing deadlines without real progress? Without the right metrics, it's easy to end up working more, not necessarily better or faster. Engineering metrics provide the clarity needed to pinpoint exactly where you're succeeding and where you’re falling short.
Tracking key metrics like deployment frequency, lead time, and MTTR enables you to make data-driven decisions that enhance both speed and quality.
For instance, teams that stay focused for 3-6 months, with 100% dedication and no context switching, experience significant improvements in velocity and throughput. These metrics are essential for translating focused effort into real progress and greater impact.
In this blog, we’ll explore the key engineering metrics you need to track for success.
Overview
Engineering metrics are important for measuring your performance and optimizing software delivery.
Key metrics like deployment frequency, lead time, and MTTR reveal bottlenecks and drive quality improvements.
Automated data collection eliminates manual tracking, ensuring precise, real-time insights.
Contextual dashboards provide clarity on performance trends, empowering informed, decisive actions.
Metrics alone aren’t enough; intelligent automation and continuous feedback are essential for driving sustained improvements.
What Are Engineering Metrics and Why Do They Matter?
Engineering metrics are specific data points that evaluate how efficiently you and your team deliver software. Metrics like Dora Metrics (Deployment Frequency, Lead Time for Changes, Change Failure Rate, and MTTR), Code Churn, and Cycle Time help track the speed of moving features from development to production. It also checks the frequency of deployments and the efficiency in addressing issues and reducing rework.
These metrics directly impact your ability to reduce downtime, speed up releases, and improve code quality. By measuring these aspects, you can identify bottlenecks, improve workflows, and make data-driven decisions to enhance overall software delivery and meet business goals more effectively.
Also Read: AI Code Review Techniques and Top Tools
Top 10 Engineering Metrics You Should Track in 2025
The success of your software depends on knowing where improvements are needed. By focusing on the metrics mentioned below, you can fine-tune processes and enhance your engineering effectiveness.
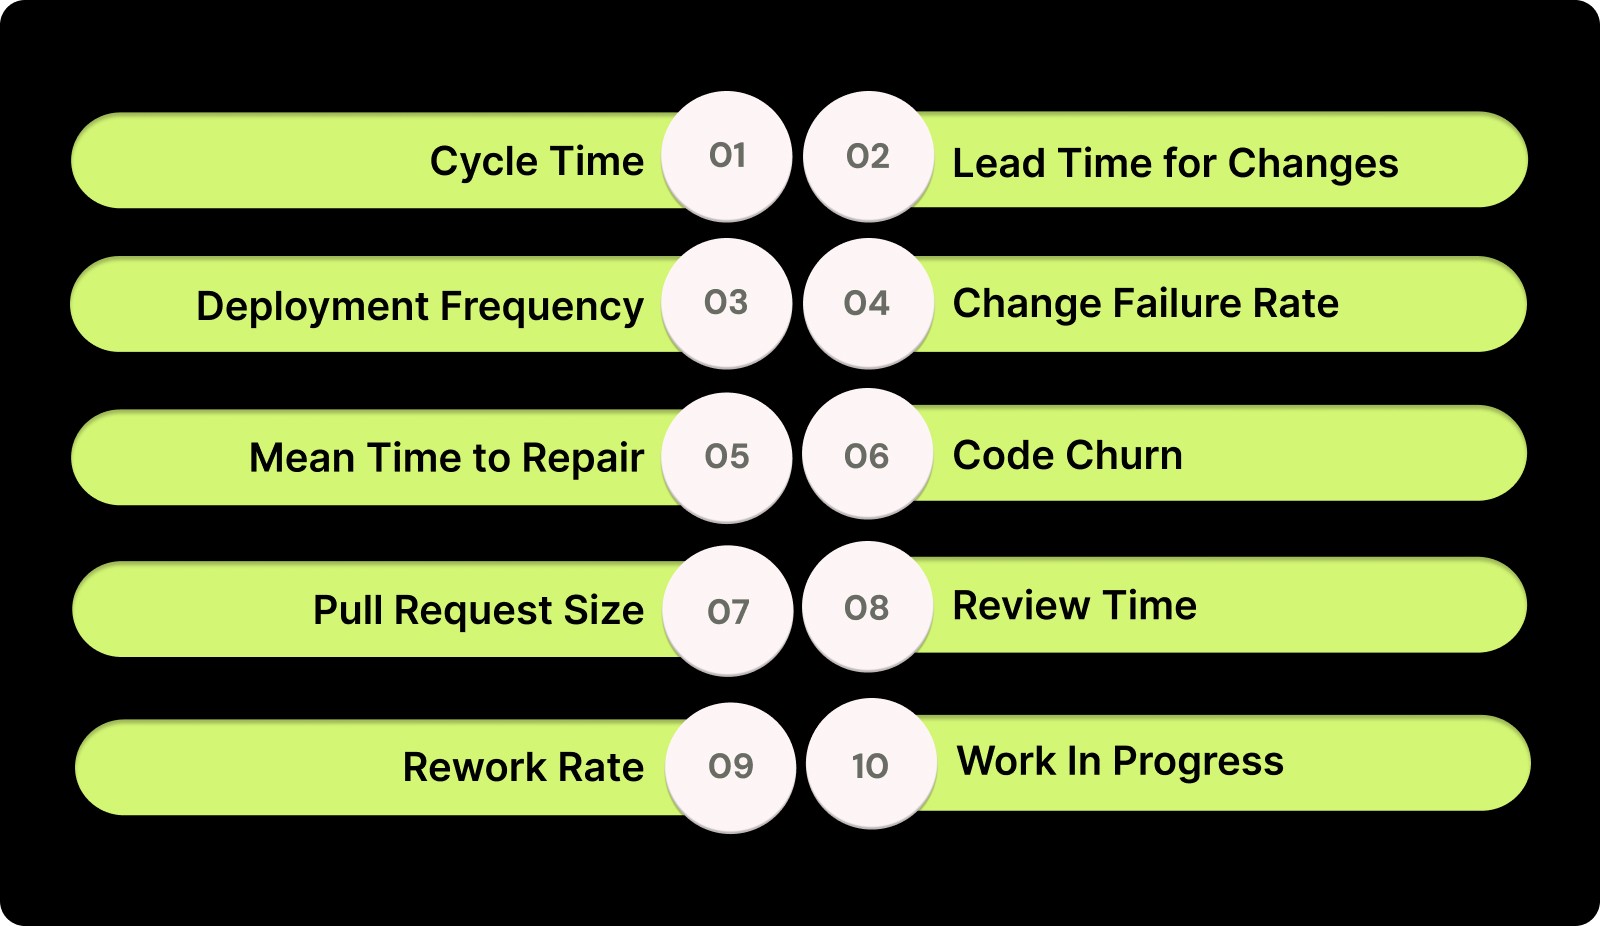
1. Cycle Time
Cycle time tracks how long it takes for a feature or task to move from start to finish in the development pipeline. A shorter cycle time means faster delivery and quicker feedback, driving a more agile development process.
How to Calculate: Track the time from the start of the task to its deployment in production. Measure this by comparing timestamps from the beginning of the task to when it is deployed.
Example: If a task starts on Monday and is deployed by Friday, the cycle time is 5 days.
2. Lead Time for Changes
Lead time measures the speed at which a change moves from commit to deployment. The shorter the lead time, the quicker you can deliver updates and respond to user feedback, making your pipeline more efficient.
How to Calculate: Track the time between a commit and its deployment to production. Measure this by comparing timestamps from the commit to when the change is live.
Example: If a commit happens on Monday and is deployed on Tuesday, the lead time is 1 day.
3. Deployment Frequency
Deployment frequency measures how often you deploy code to production. High deployment frequency indicates an efficient pipeline that can deliver continuous value to users with minimal delays.
How to Calculate: Count the number of deployments over a set period (weekly, monthly, etc.) and divide by the duration of the period to get the frequency.
Example: If you and your team deploy 5 times per week, the deployment frequency is 5 deployments per week.
4. Change Failure Rate
Change failure rate measures the percentage of deployments that fail in production. A low failure rate signals a strong code quality process, ensuring stable and reliable releases.
How to Calculate: Divide the number of failed deployments by the total deployments over a period and multiply by 100 to get the failure rate percentage.
Example: If you make 10 deployments and 2 fail, the failure rate is (2 ÷ 10) × 100 = 20%.
5. Mean Time to Repair (MTTR)
MTTR tracks how quickly you can restore service after a failure. A low MTTR shows that you are effective at identifying and resolving issues quickly, minimizing downtime and its impact on users.
How to Calculate: Measure the time from when a failure occurs to when the service is fully restored, comparing timestamps from failure to resolution.
Example: If there are 3 incidents in a month and the total downtime is 6 hours, the MTTR is (6 ÷ 3) = 2 hours.
6. Code Churn
Code churn measures how often code is rewritten, discarded, or significantly changed during development. High code churn typically signals inefficiencies or a lack of clarity in the requirements or design process.
How to Calculate: Track the frequency with which code is changed or deleted after it has been initially written. Monitor the ratio of rewritten or discarded code compared to stable code.
Example: If you rewrite a feature three times before finalizing it, the churn rate would be considered high for that feature, indicating possible issues in planning or scope clarity.
7. Pull Request (PR) Size
PR size refers to the volume of code submitted for review in a single pull request. Larger PRs can slow down the review process, so it’s important to keep them manageable to enhance code quality and speed up reviews.
How to Calculate: Measure the number of lines of code in each pull request. A smaller PR with fewer lines of code is typically easier to review.
Example: If you regularly submit PRs with more than 500 lines of code, consider splitting them into smaller, focused requests to speed up the review and feedback cycle.
8. Review Time
Review time measures how long it takes for code to be reviewed and merged into the main branch. Faster review times reduce bottlenecks and enable quicker feedback cycles, ultimately speeding up your development process.
How to Calculate: Track the average time between when a pull request is created and when it is merged. The shorter this time, the more efficiently you are reviewing and integrating changes.
Example: If you regularly take 3 days to review PRs, try to reduce it to 1-2 days to enhance the speed of your feedback loop.

9. Rework Rate
Rework rate tracks the percentage of tasks or features that need to be revisited or reworked after they’ve been completed. A high rework rate often signals issues with planning, unclear requirements, or inadequate testing.
How to Calculate: Divide the number of tasks or features requiring rework by the total number of tasks completed. A high percentage indicates inefficiencies in the initial stages of development.
Example: If 5 out of 10 tasks require revisions after completion, your rework rate is 50%, signaling that you need to improve your requirements gathering or initial testing phases.
10. Work In Progress (WIP)
Work in Progress measures the number of tasks that are actively being worked on at any given time. Limiting WIP ensures that you are focused on completing tasks before starting new ones. This helps in reducing distractions and inefficiencies.
How to Calculate: Track the number of tasks in progress at any point during a sprint. WIP limits help ensure that no more than a certain number of tasks are worked on simultaneously.
Example: If you currently handle 10 tasks at once but struggle to complete them on time, consider limiting the WIP to 5 tasks to improve focus and throughput.
Also Read: Top 8 Developer Productivity Tools For Maximum Efficiency
Advanced Engineering Metrics: Going Beyond the Basics
As software development becomes more complex, metrics like Cumulative Flow and Throughput offer deeper insights into your performance, pipeline efficiency, and delivery quality.
1. Cumulative Flow
Cumulative Flow is a visual tool that shows the amount of work in progress at each stage of your workflow. The Cumulative Flow Diagram (CFD) tracks the number of tasks in stages like "To Do," "In Progress," and "Done." By monitoring this, you can easily spot bottlenecks and inefficiencies in your process.
How to Calculate: Track the number of tasks in each stage of your pipeline (e.g., "To Do," "In Progress," "Done") and plot them over time. The diagram will show you where tasks accumulate, signaling potential delays or bottlenecks.
Example: If your "In Progress” section consistently increases while “Done” remains low, you may need to adjust resources or streamline processes to ensure tasks are completed more efficiently.
2. Throughput
Throughput measures the amount of work completed over a given period of time, typically tracked by the number of tasks or features delivered in a set timeframe (e.g., weekly or monthly). This metric helps gauge how much work is getting done and whether you are on track to meet goals.
How to Calculate: Count the number of tasks, features, or user stories completed during a specific time period. The higher the throughput, the more work you are accomplishing.
Example: If you complete 20 user stories in a 2-week sprint, the throughput is 20 stories per sprint. Higher throughput means you are delivering more, but it’s essential to balance speed with quality.
By tracking advanced engineering metrics, you can continuously refine your processes, optimize workflows, and ensure faster, more reliable software delivery.
How to Turn Engineering Metrics into Actionable Insights and Integrate Them into Your Workflow?
Metrics are only valuable if you know how to turn them into actionable insights. Here’s how you can utilize metrics to make better decisions, optimize your workflow, and continuously improve your performance.
1. Turning Data into Strategy
To turn metrics into strategy, align them with your objectives. Metrics like cycle time, lead time, and deployment frequency should reflect your goals, whether that’s faster feature delivery, higher-quality code, or faster recovery times after failures.
2. Seamless Integration
With Entelligence AI, integrating metrics into your workflow is effortless. The tool automatically collects data from your existing tools, displaying key metrics like MTTR and deployment frequency without interrupting your daily work. This ensures that metrics become a natural part of your workflow.
Steps for Implementation:
Automate Data Collection: Use AI tools to gather data and avoid manual input, ensuring accuracy.
Actionable Dashboards: Visualize your key metrics on real-time dashboards that help you make quick decisions.
Align with Your Goals: Ensure your metrics support your strategic objectives, whether that's improving cycle time or reducing failure rates.
Continuous Feedback Loops: Use data-driven insights to continuously refine your processes and improve efficiency.
With these implementation steps in place, you're well on your way to optimizing your engineering processes. Now, let’s explore the best practices to ensure lasting success.
Best Practices for Incorporating Engineering Metrics into Your Engineering Process
While tracking engineering metrics is essential, following the right best practices ensures that these metrics actually drive meaningful improvements in your process.
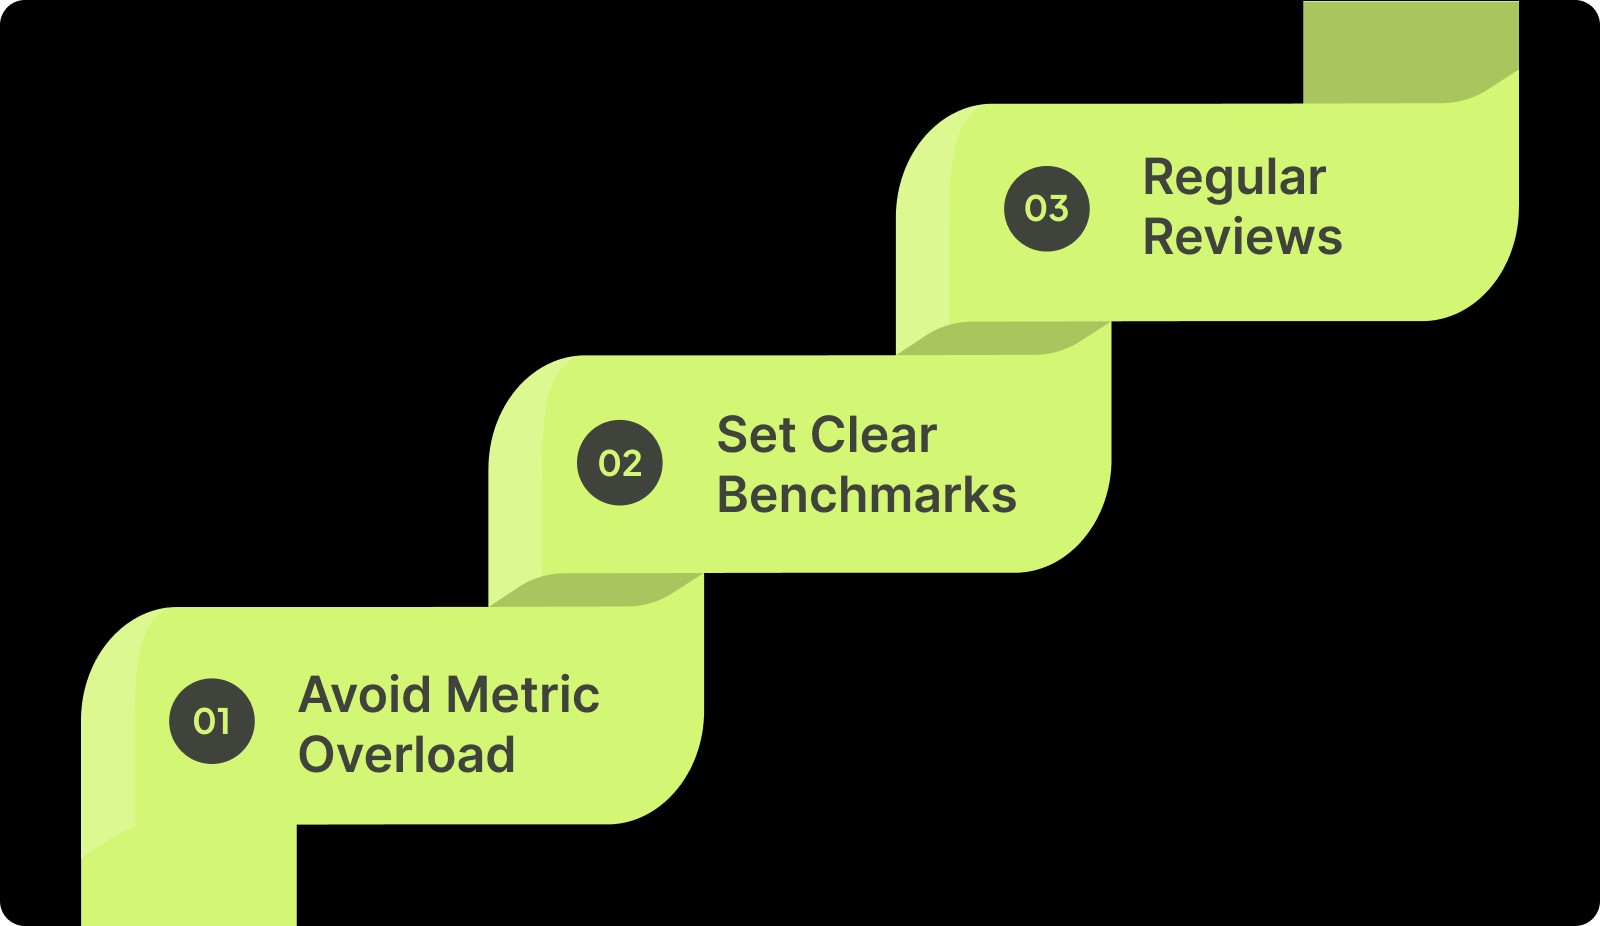
1. Avoid Metric Overload
Tracking too many metrics can cause confusion and dilute focus. Identify the most impactful metrics, such as deployment frequency, lead time, and MTTR, and use them to measure your progress against specific, strategic goals. Narrow your focus to avoid data paralysis and ensure every metric directly drives performance improvements.
2. Set Clear Benchmarks
Before tracking any metrics, establish a baseline for each one. Know where you stand today so you can clearly measure progress. For example, if your lead time is 14 days, set a specific target to reduce it to 10 days over the next quarter. These benchmarks act as clear targets, helping you evaluate if your efforts are truly paying off.
3. Regular Reviews
Metrics should be at the core of your continuous improvement process. Incorporate them into your sprint reviews or retrospectives so you are always aligned with progress and aware of what needs refinement. Regular reviews allow you to act quickly on insights, adjusting course before small issues grow into bigger problems.

Common Pitfalls When Using Engineering Metrics
Even with the best intentions, mistakes can be made when implementing engineering metrics. Here are some common pitfalls to watch out for:
1. Focusing Too Much on Speed
Prioritizing speed over quality can backfire. High deployment frequency without adequate testing leads to increased change failure rates, resulting in unstable releases, poor customer experience, and significant time lost to fixing issues.
2. Ignoring Context
Metrics like lead time can be misleading if you don’t consider the full context. High lead times may result from inefficient manual processes rather than pipeline inefficiencies, leading to misguided improvements and wasted resources.
3. Not Setting Baselines
Without clear baselines, you can't accurately track progress. Not knowing your starting point for metrics like MTTR can result in unrealistic expectations and ineffective changes, preventing meaningful improvements over time.
Also Read: Comprehensive Guide to Secure Code Review Practices
How Entelligence AI Brings Clarity to Engineering Metrics?
Tracking engineering metrics is often easier said than done. Engineering leaders frequently face challenges like scattered data, manual tracking, and limited visibility into what’s actually driving performance, speed, and efficiency. Without real-time insights, these metrics become just numbers on a dashboard instead of powerful tools for improvement.
Entelligence AI transforms engineering metrics into actionable insights. By automating data collection and surfacing key insights across every role, our platform ensures that leaders, managers, and developers like you don’t just see the metrics but also understand why performance trends are occurring.
Here’s what Entelligence AI delivers:
Automated Data Collection: Say goodbye to spreadsheets and manual updates. Entelligence AI automatically collects data from your development tools, providing accurate, up-to-date metrics on deployment frequency, lead time, MTTR, and code quality without manual intervention.
Context-Rich Dashboards: Our dashboards offer more than just raw data. They provide deep insights into the story behind each number. By connecting engineering metrics to real-time progress and outcomes, we give you the context needed to make informed decisions that drive improvement.
Team-Level Clarity: Entelligence AI gives you a clear view of your and your team’s performance across all levels. Spot strengths, weaknesses, and bottlenecks at the squad, repo, or service level, helping you identify areas that need attention and teams that are excelling.
Strategic Visibility: Gain comprehensive visibility into your performance trends across the organization. With real-time insights, you can easily make data-driven decisions on resourcing, process improvements, and long-term strategy without relying on outdated reports.
With Entelligence AI, engineering metrics scale from basic numbers to powerful, actionable insights, fueling clarity, accountability, and continuous improvement.

Conclusion
Engineering metrics provide the insights needed to fine-tune your software delivery process, improving both speed and quality. By focusing on metrics like deployment frequency, lead time, and MTTR, you can identify inefficiencies and gaps that slow down your progress.
However, effectively tracking these metrics and ensuring continuous improvement requires intelligent automation. Entelligence AI streamlines this process by automating the collection of key data and reducing manual effort, giving you real-time, actionable insights.
With real-time data and context-rich dashboards, you can make faster, smarter decisions and optimize workflows without sacrificing quality. Ready to enhance your engineering performance? Start your free trial with Entelligence AI today and see immediate improvements.
Frequently Asked Questions
1. What is a metric vs. a KPI?
A metric is any measurable data point used to track performance, while a KPI (Key Performance Indicator) is a specific metric tied to strategic objectives. KPIs help assess whether you're meeting business goals, whereas metrics provide general performance insights.
2. What would happen if engineers didn't use metrics?
Without metrics, engineers would lack clear benchmarks for performance. This leads to inefficiencies, missed opportunities for improvement, and difficulties in measuring progress. Without data, decisions would be based on assumptions, negatively affecting productivity and software quality.
3. What are some useful engineering metrics you track in your organization?
Common engineering metrics include deployment frequency, lead time, MTTR, code quality, and change failure rate. These metrics help monitor software delivery speed, stability, and team efficiency, providing actionable insights to improve processes and drive continuous improvement.
4. What metrics actually help you understand individual engineer performance?
Metrics like PR size, review time, commit frequency, and bug resolution time can offer insights into an engineer's productivity, collaboration, and code quality. These help track efficiency, identify strengths, and pinpoint areas for improvement at the individual level.