


Top 34 Continuous Integration Metrics Every Engineering Team Should Track
The global continuous delivery market is booming, valued at USD 5.27 billion in 2025 and projected to reach USD 12.31 billion by 2029. Organizations are investing heavily in CI/CD pipelines to ship software faster and more reliably, but building the pipeline is only half the battle. Many teams still underutilize metrics that reveal whether those pipelines are actually performing as intended.
Continuous integration metrics show what really matters: how quickly builds run, how reliable tests are, and where recurring failures occur. They turn raw pipeline data into actionable insights that help teams eliminate bottlenecks, reduce failures, and improve overall software quality.
In this guide, we’ll explore the most important continuous integration metrics for 2026, explain why they matter, and show how to track them effectively. Use these metrics to transform your CI/CD pipeline into a high-performing engine that delivers faster, safer, and more confident releases.
Key Takeaways
CI metrics guide actionable improvements: Metrics like build duration, test reliability, and deployment frequency highlight bottlenecks and areas for performance gains.
Quality and speed are interconnected: Tracking test coverage, flaky tests, and escaped defects ensures fast delivery doesn’t compromise software stability.
Fast incident response protects users and reputation: Monitoring MTTR, MTTD, and change failure rates helps teams recover quickly from failures.
Measure what matters, not everything: Focus on goal-driven KPIs that tie directly to business outcomes and team efficiency, avoiding dashboard clutter.
Optimize resources for scale and efficiency: Tracking deployment size, cost per build, and pipeline efficiency helps reduce costs while boosting developer productivity.
What Are Continuous Integration (CI) Metrics and Why Do They Matter?
Continuous Integration (CI) metrics are measurable indicators that show how effectively your team integrates code changes into a shared repository. They track the speed, reliability, and efficiency of your build, test, and merge processes, giving you visibility into the overall health of your CI pipeline. Key areas include:
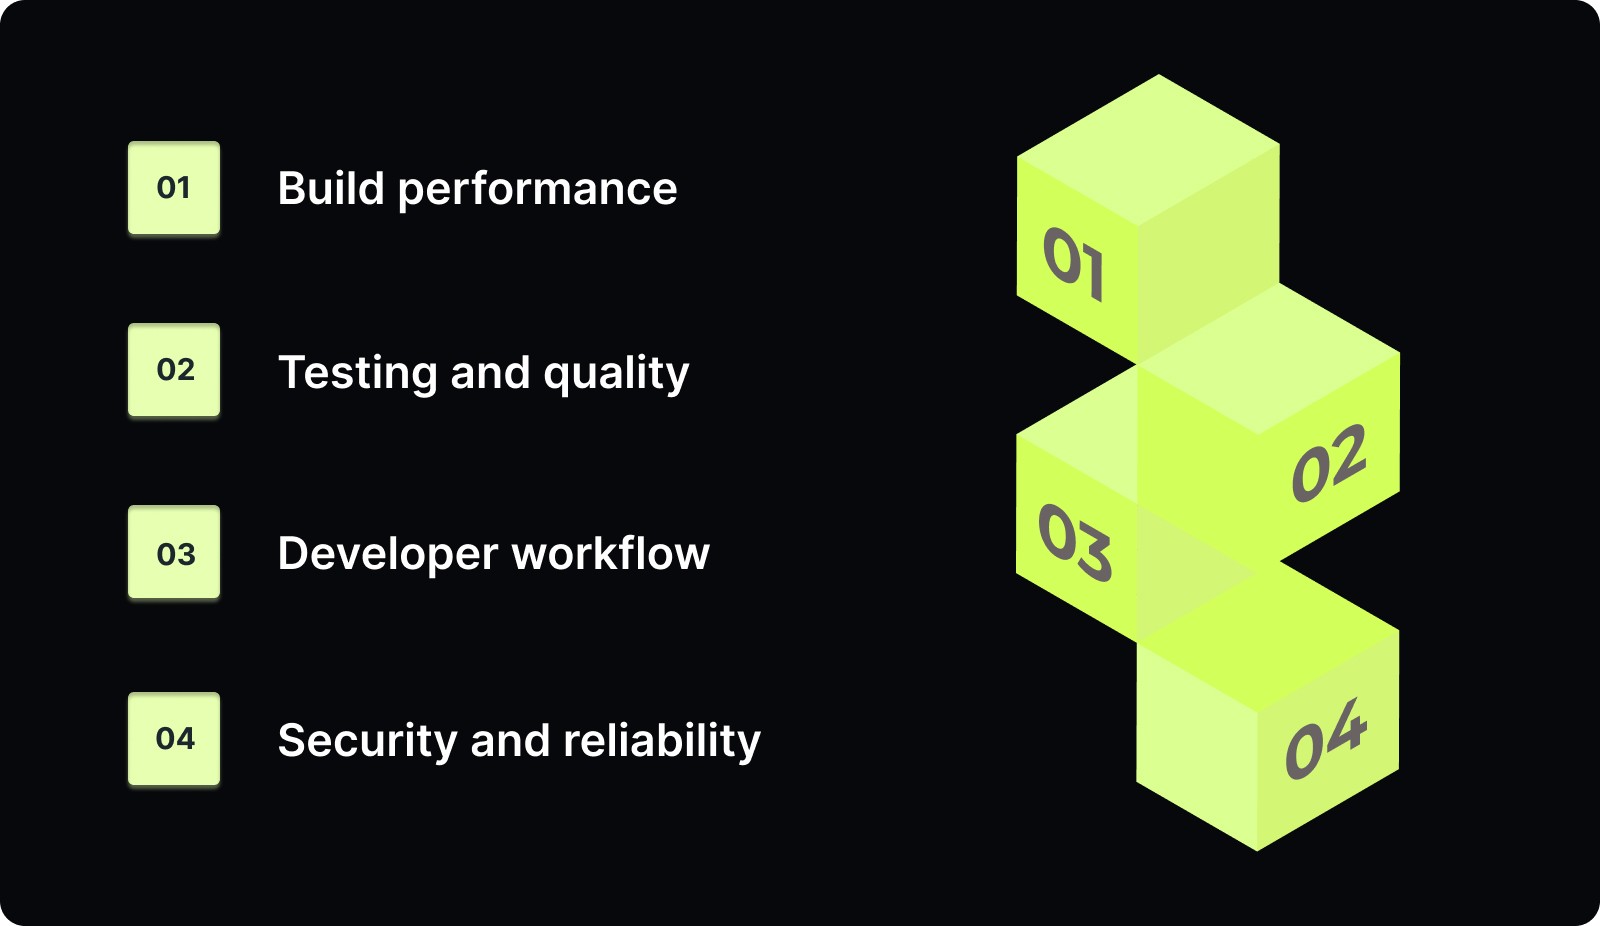
Build performance: how long builds take and how often they fail.
Testing and quality: effectiveness of automated tests in catching issues early.
Developer workflow: bottlenecks in code reviews, merges, or approvals.
Security and reliability: vulnerabilities, misconfigurations, or changes that may trigger incidents.
Tracking CI metrics helps teams detect slow pipelines, recurring failures, declining quality, infrastructure bottlenecks, and release risks. With consistent monitoring, these metrics turn raw data into actionable insights, enabling faster builds, stable releases, and confident software delivery.
The 35 Most Important Continuous Integration Metrics (2026)
Tracking the right continuous integration metrics separates high-performing teams from those stuck in endless deployment cycles.
Each metric includes a clear definition, why it matters, and how to measure it. Use this as your reference guide when building dashboards, setting team goals, or diagnosing problems in your CI/CD pipeline.
Build Performance & Pipeline Efficiency
These metrics show how efficiently your CI pipeline processes code changes. Slow builds kill developer productivity, so these are often the first numbers teams track.
1. Build Failure Rate
Build failure rate is the percentage of builds that fail out of the total number of attempted builds. Frequent failures indicate unstable code, environmental issues, or recurring test problems that require immediate attention.
Formula: (Total build failures / Total attempted builds) × 100
What good looks like: 5-10% for healthy teams. Above 15% requires immediate investigation.
2. Build Duration
Build duration tracks the average time to complete a single build or pipeline stage from start to finish. This is critical because developers need fast feedback to maintain flow state and stay productive.
Formula: Sum of build times / Number of builds
What good looks like: Under 10 minutes for elite performers, under 20 minutes for high performers.
3. Build Success Rate
Build success rate measures the percentage of builds that pass successfully without errors or failures. This is the inverse of build failure rate, but tracking both helps you focus on stability.
Formula: (Successful builds / Total builds) × 100
What good looks like: 90-95% for healthy pipelines. A score below 85% indicates major problems. A score above 98% might indicate that the tests aren't rigorous enough.
4. Cycle Time
Cycle time measures the duration from when work starts on a task to when it's delivered to end-users, excluding time spent in backlog. It's an internal efficiency metric that reveals how smoothly your development process flows.
Formula: End date - Start date (when work begins)
What good looks like: Depends on team size and project complexity, but trending downward is key.
5. Mean Time to Build (MTTB)
Mean time to build tracks the average time from build initiation to completion across all builds. It focuses on the complete build process, including compilation, testing, and packaging.
Formula: Sum of build times / Number of builds
What good looks like: Under 10 minutes for most teams.
Deployment Frequency & Release Readiness
These metrics measure how often you're shipping code and how reliable those deployments are. They directly impact your ability to respond to customer needs and market changes.
6. Deployment Frequency
Deployment frequency measures how often production changes are released. One of the four DORA metrics indicates your team's agility and ability to deliver value continuously.
Formula: Number of deployments / Time period
What good looks like: Multiple times per day (elite), daily to weekly (high performers).
7. Deployment Failure Rate
Deployment failure rate tracks the percentage of deployments that fail in production. Another DORA metric reveals the quality of your deployment process and the effectiveness of your testing.
Formula: (Failed deployments / Total deployments) × 100
What good looks like: Under 15% for elite teams, under 20% for high performers.
8. Deployment Size
Deployment size measures the average number of lines of code released per deployment. Smaller deployments reduce risk and make issues easier to identify and fix.
Formula: Lines of code / Deployment
What good looks like: Under 200 lines for most changes, under 500 for complex features.
9. Rollback Rate
Rollback rate tracks the percentage of deployments rolled back due to production issues. It reveals how often you need to revert changes because they caused problems in production.
Formula: (Rollbacks / Total deployments) × 100
What good looks like: Under 5% for healthy teams. Above 10% indicates quality gaps.

Testing Quality & Reliability
These metrics ensure your tests are actually catching bugs before they reach production. They balance speed with quality, making sure you're not just shipping fast but shipping well.
10. Test Coverage
Test coverage measures the percentage of functional requirements that tests exercise. It focuses on whether automated tests protect critical user workflows and features.
What good looks like: 70-80% for application code, 90%+ for critical paths.
11. Code Coverage
Code coverage tracks the percentage of code executed during testing. More specific than test coverage, it measures which lines of code actually run during your test suite execution.
Formula: (Lines of code tested / Total lines of code) × 100
What good looks like: 70-85% for production code, 95%+ for critical business logic.
12. Test Pass Rate
Test pass rate measures the percentage of test cases that pass in a build. It indicates code stability and the effectiveness of your testing practices.
Formula: (Passed tests / Total tests) × 100
What good looks like: 95-98%. A score below 90% indicates serious quality issues.
13. Test Failure Rate
Test failure rate tracks the proportion of failing tests in a test suite. It's the inverse of the test pass rate, but tracking failures helps you focus explicitly on problems that need fixing.
Formula: (Failed tests / Total tests) × 100
What good looks like: 2-5% in early pipeline stages, under 1% post-merge.
14. Time to Fix Tests
Time to fix tests measures the average time to resolve a failing test from detection to consistent passing. Fast fixes maintain trust in your testing suite and prevent teams from ignoring failures.
Formula: Fix completion time - Test failure detection time
What good looks like: Under 4 hours for critical tests, under 24 hours for all tests. Tests that have been broken for more than a week should be deleted or quarantined.
15. Automated Test Ratio
The automated test ratio measures the percentage of tests that are automated versus those that are manual. Higher automation improves efficiency and enables faster feedback loops for developers.
Formula: (Automated tests / Total tests) × 100
What good looks like: 80%+ for mature teams.
16. Flaky Test Rate
Flaky test rate tracks tests that pass and fail intermittently without any code changes. These unreliable tests destroy developer confidence in the entire CI system.
Formula: (Flaky tests / Total tests) × 100
What good looks like: Under 2%. Above 5% requires immediate attention.
Incident Detection & Recovery
These metrics measure how quickly you detect and fix problems when they occur. Fast detection and recovery minimize customer impact and reduce the cost of failures.
17. Change Failure Rate
Change failure rate measures the percentage of code changes causing failures in production. One of the four DORA metrics directly measures the quality of your deployment process.
Formula: (Failed changes / Total changes) × 100
What good looks like: Below 15% (elite), below 30% (high performers).
18. Failed Deployments
Failed deployments track the total number of deployments that fail and require urgent fixes or rollbacks. It highlights weak points in your release process that affect reliability and lead time.
What good looks like: Decreasing trend over time.
19. Mean Time to Detect (MTTD)
Mean time to detect measures the average time to identify bugs in development or production. Fast detection means you can fix issues before they impact many customers.
Formula: Detection time - Incident start time
What good looks like: Under 5 minutes for critical systems, under 15 minutes for most services.
20. Mean Time to Recover (MTTR)
Mean time to recovery (MTTR) is the average time to recover from a bug or outage. One of the four DORA metrics, it measures your team's ability to respond to failures effectively.
Formula: Recovery completion time - Incident detection time
What good looks like: Under 1 hour (elite), under 1 day (high performers).
21. Time to Restore Service
Time to restore service measures how long it takes to resume regular service after a failure. It shows your team's readiness and ability to maintain uptime under pressure.
Formula: Service restored time - Failure time
What good looks like: Under 1 hour for most incidents.
Defects & Bug Management
These metrics track how well you're managing bugs and preventing defects from escaping to production. They reveal the quality of your code and testing practices.
22. Defect Count
Defect count tracks the total bugs reported across all environments, including development, staging, and production. Rising defect counts indicate quality or process issues that need to be addressed.
What good looks like: Decreasing trend over time.
23. Defect Resolution Time
Defect resolution time measures the average time to fix a reported bug from detection to deployment of the fix. Shorter times reflect efficient issue management and responsive teams.
Formula: Fix completion time - Bug reporting time
What good looks like: Under 24 hours for critical bugs, under 1 week for medium priority.
24. Lead Time for Changes
Lead time for changes measures the time from the start of development to the production deployment of a single code change. One of the four DORA metrics is a key indicator of team agility.
Formula: Deployment date - Development start date
What good looks like: Under 24 hours (elite), under 1 week (high performers).
25. Escaped Defects
Escaped defects track bugs discovered in production that slipped through all testing phases. It indicates gaps in your testing and QA processes.
Formula: (Defects in production / Total defects) × 100
What good looks like: Under 5% for elite teams, under 10% for high performers.
26. Technical Debt Ratio
The technical debt ratio measures the proportion of code that needs refactoring or improvement. High debt slows development and increases the risk of failures over time.
Formula: (Technical debt / Total code) × 100
What good looks like: Decreasing trend with under 5% for new code.
27. Hotfix Rate
Hotfix rate tracks the frequency of emergency fixes applied to production outside your normal release process. High rates indicate unstable releases or weak QA coverage before deployment.
Formula: Hotfixes / Total releases
What good looks like: Under 5% of releases requiring hotfixes.
28. Merge/Commit Frequency
Merge/commit frequency measures the average number of commits or merges per developer over time. It shows how actively developers integrate code and whether they're making small, manageable changes.
Formula: Total commits / Time period
What good looks like: Multiple commits per day per developer.
Business Impact & Customer Experience
These metrics connect your engineering work to business outcomes and customer satisfaction. They help you demonstrate ROI and align engineering investments with company goals.
29. Time to Value (TTV)
Time-to-value measures how quickly end users see the benefits of a change or feature after development begins. Faster TTV improves customer satisfaction and product momentum.
Formula: Feature usage date - Deployment date
What good looks like: Under 2 weeks for small features, under 1 quarter for large initiatives.
30. Uptime
Uptime tracks the percentage of time your systems are available and functioning correctly. It reflects reliability and operational stability, directly impacting customer experience.
Formula: (Available time / Total time) × 100
What good looks like: 99.9%+ for production systems.
31. Customer Satisfaction (CSAT/NPS)
Customer satisfaction measures user feedback through surveys, ratings, or support channels. It's a direct measure of how your CI/CD quality impacts end-user experience.
What good looks like: CSAT above 80%, NPS above 30.
32. Incident Rate
Incident rate tracks the number of production incidents per release. It shows the risk and stability of your deployments, revealing whether releases consistently cause problems.
Formula: Incidents / Number of releases
What good looks like: Under 0.1 incidents per release.
33. Release Predictability
Release predictability measures the percentage of releases delivered on schedule. It reflects planning accuracy, team efficiency, and overall project reliability.
Formula: (On-time releases / Total releases) × 100
What good looks like: 80%+ for mature teams.
34. Cost per Build
Cost per build tracks the infrastructure cost for each CI pipeline execution. As teams scale, CI costs can balloon, making this metric crucial for optimizing resource usage.
Formula: Total CI infrastructure cost / Total builds
What good looks like: Stable or decreasing as you optimize processes.
However, you don’t need to track all 34 CI metrics; focus on the ones that matter most to your team. Using these metrics wisely will help you spot bottlenecks, improve your workflow, and deliver reliable software faster.
How to Track Continuous Integration Metrics (Step-by-Step Guide)
Tracking continuous integration metrics effectively requires more than just enabling dashboards in your CI tool. You need a systematic approach to collection, visualization, and continuous improvement.
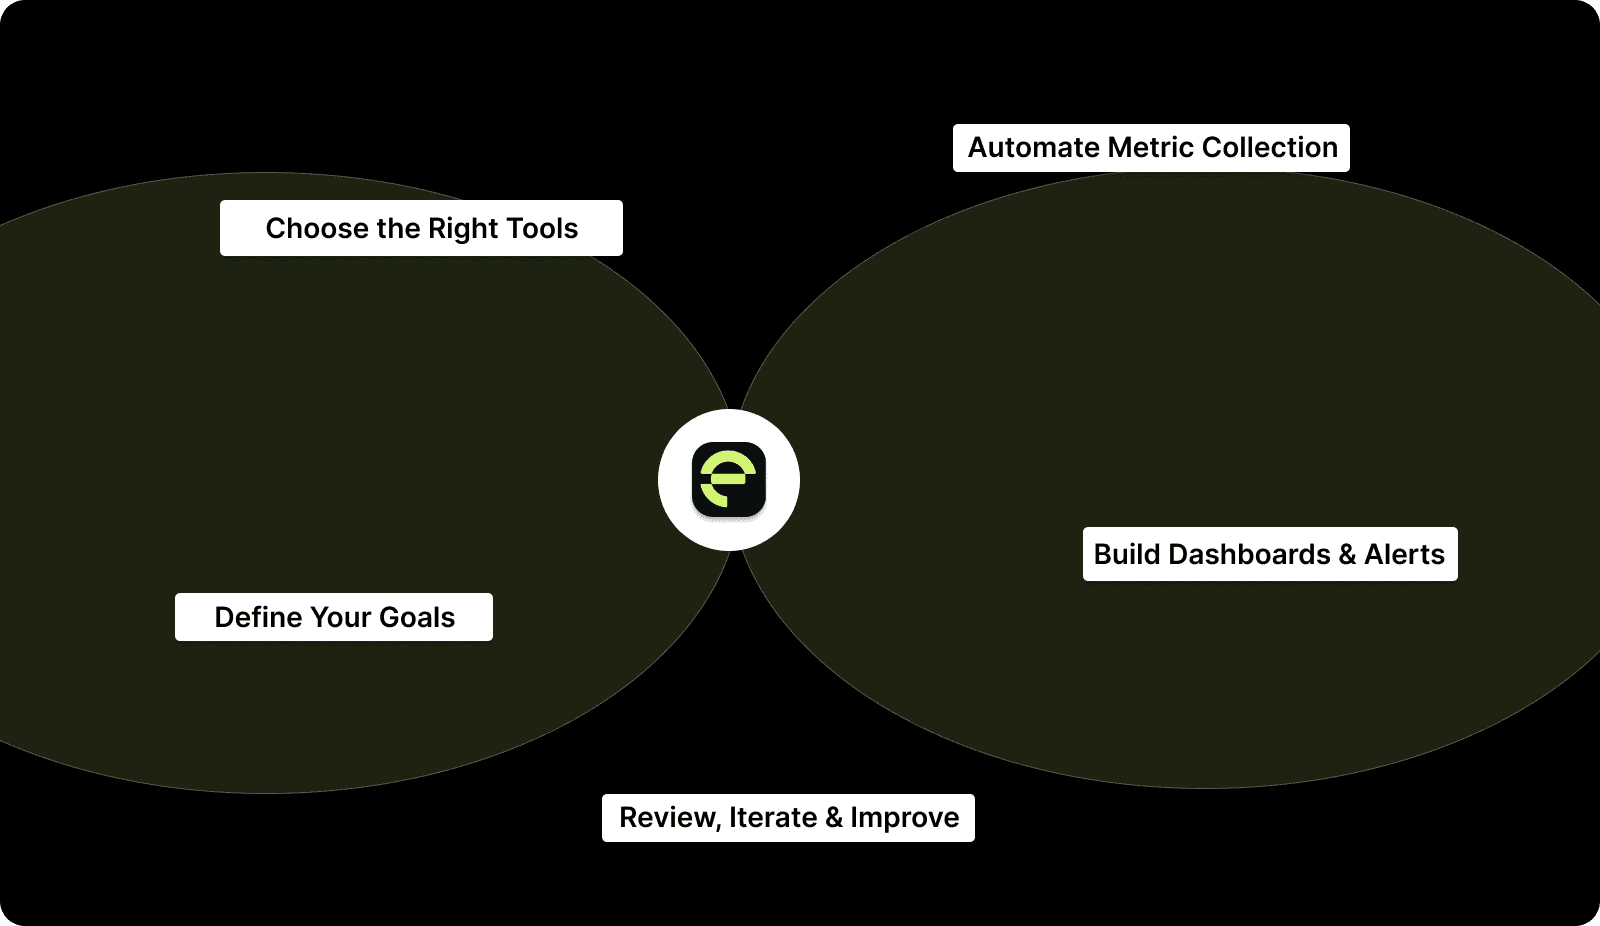
Step 1: Define Your Goals
Clarify what your team wants to achieve. Metrics without purpose are noise.
Align metrics with business objectives such as shipping faster, improving quality, or reducing costs.
Translate objectives into measurable outcomes.
Reduce the lead time for changes from 2 weeks to 3 days.
Increase deployment frequency from weekly to daily.
Involve your team so that developers, managers, and DevOps provide insights.
Document what success looks like to keep everyone aligned.
Step 2: Choose the Right Tools
Your CI/CD tools determine what metrics you can track and how easily.
Audit your stack, including CI platforms, version control, testing frameworks, and monitoring tools.
Prefer tools that provide built-in metrics, integrations, and historical data, such as Entelligence AI.
Start simple and add specialized platforms only when needed.
Step 3: Automate Metric Collection
Manual tracking does not scale. Automation is key.
Use CI webhooks to capture build events, test results, and deployments.
Leverage integrations with dashboards, analytics tools, or messaging apps.
Standardize metrics across teams to ensure consistent definitions.
Set up a simple data pipeline to collect, process, store, and visualize metrics.
Validate data and sample high-volume metrics to maintain accuracy.
Step 4: Build Dashboards and Alerts
Metrics matter when they are visible and actionable.
Create dashboards for developers, managers, and leadership.
Highlight the most important metrics and show trends over time.
Configure alerts by severity to avoid alert fatigue.
Make dashboards accessible through shared screens, email summaries, and sprint reviews.
Step 5 Review, Iterate, and Improve
Metrics tracking is continuous.
Establish a review schedule: daily for critical alerts, weekly for team trends, quarterly for strategic goals.
Celebrate improvements and retire metrics that do not drive action.
Adjust targets as performance improves and watch for unintended consequences.
Share successful practices across teams.
Following these steps turns CI metrics into insights that help your team deliver faster, more reliably, and at higher quality. To make tracking and acting on these metrics easier, use tools like Entelligence AI that unifies data from all your CI/CD tools into a single actionable dashboard, giving you visibility into bottlenecks, build performance, and team productivity without manual effort.

Proven Ways to Improve Continuous Integration Metrics
Tracking metrics reveals problems. Improving them requires deliberate action. Here's how to systematically boost your most important continuous integration metrics.
Reduce Build Duration
Slow builds kill developer productivity. Here's how to speed them up:
Parallelize your tests. Instead of running 1,000 tests sequentially, split them across 10 runners. Most CI platforms support matrix builds and test parallelization. This can cut build time by 60-80%.
Implement incremental builds. Don't rebuild your entire codebase for every change. Tools like Bazel, Buck, and Gradle support incremental compilation, which rebuilds only what has changed.
Cache dependencies aggressively. Don't download NPM packages or Maven dependencies on every build. Configure your CI to cache these artifacts and only re-download when they change.
Optimize your Docker images. Use multi-stage builds to keep final images small. Order Dockerfile commands so that frequently changing layers are at the end, maximizing cache utilization.
Move slow tests to separate pipelines. Run fast unit tests on every commit. Run slow integration tests on merge to main or nightly. This gives developers fast feedback while maintaining comprehensive testing.
Increase Build Success Rate
Frequent build failures slow everything down. Fix them systematically:
Invest in test stability. Identify flaky tests with tools that track test pass/fail patterns. Quarantine or fix flaky tests immediately; don't let them accumulate.
Strengthen pre-commit checks. Run linting, formatting, and basic tests locally before code even reaches CI. Tools like Husky for Git hooks or pre-commit frameworks catch obvious issues early.
Improve test quality. Tests that pass incorrectly are worse than no tests at all. Review failing tests to ensure they're catching real issues, not testing implementation details.
Standardize environment configuration. Environmental differences cause builds to fail unpredictably. Use Docker containers or infrastructure-as-code to ensure consistent environments across local, CI, and production.
Decrease PR Review Time
Long review cycles destroy velocity. Speed them up:
Set team norms around review SLAs. Agree that PRs should receive first review within 4 hours. Make code review a priority, not something done "when there's time."
Reduce PR size. Smaller PRs (under 200 lines) get reviewed faster and more thoroughly. Coach developers to break work into smaller chunks.
Use automated review tools. AI-powered code review from tools like Entelligence AI catches obvious issues before human reviewers see the PR, letting humans focus on architecture and logic.
Rotate review responsibilities. Don't bottleneck on senior engineers. Spread review load across the team. Junior developers learn from reviewing others' code.
Batch review time. Some teams schedule dedicated review blocks where everyone reviews open PRs. This prevents PRs from languishing for days.
Lower Defect Escape Rate
Bugs reaching production hurt customers and reputation. Prevent them:
Expand test coverage in critical paths. Identify which features generate the most customer impact when broken. Ensure these have 90%+ test coverage.
Add integration and end-to-end tests. Unit tests catch implementation bugs. Integration tests catch interaction bugs. E2E tests catch workflow bugs. You need all three layers.
Implement canary deployments. Deploy changes to 5% of users first. Monitor for errors before full rollout. This catches issues in production with minimal customer impact.
Conduct regular code reviews of test code. Treat test code with the same rigor as production code. Bad tests are worse than no tests because they give false confidence.
Use chaos engineering in staging. Deliberately inject failures to ensure your error handling works. Tools like Chaos Monkey reveal hidden fragility.
Improve Deployment Frequency
Deploying more often reduces risk and accelerates feedback. Here's how:
Automate everything. Manual deployment steps slow you down and introduce errors. Full automation enables multiple deployments per day.
Adopt feature flags. Decouple deployment from release. Deploy code with features turned off, then enable them gradually. This separates technical risk from business risk.
Reduce batch size. Deploy smaller changes more often rather than large changes infrequently. Small deployments are easier to test, review, and roll back if needed.
Build deployment confidence. The reason teams don't deploy often is fear. Build confidence through comprehensive monitoring, automated rollback, and gradual rollout strategies.
Remove deployment gates that don't add value. If every deployment requires VP approval, you'll deploy at most once a week. Streamline approvals for low-risk changes.
Reduce MTTR
Fast recovery minimizes customer impact. Speed it up:
Implement one-click rollback. When things break, every minute counts. Automated rollback lets anyone on call restore service immediately.
Improve observability. You can't fix what you can't see. Comprehensive logging, metrics, and tracing help you diagnose issues quickly.
Practice incident response. Run game days where you simulate production incidents. This trains teams to respond effectively under pressure.
Maintain runbooks for common issues. Document solutions to recurring problems so anyone can execute the fix, not just the person who built the system.
Post-incident reviews focus on learning, not blame. After every incident, ask: "What did we learn? How do we prevent this category of issue in the future?"
Optimize CI Infrastructure Costs
As teams scale, CI costs can explode. Control them:
Right-size your runners. Don't use expensive high-memory instances for simple builds. Match compute resources to actual needs.
Implement build caching. Avoid rebuilding artifacts that haven't changed. This saves both time and computing costs.
Scale runners dynamically. Use auto-scaling to spin up capacity during peak hours and scale down overnight. Cloud-based CI platforms do this automatically.
Optimize test efficiency. Remove redundant or low-value tests. Ensure each test provides unique value.
Monitor and alert on cost spikes. Set budgets and get notified when costs exceed thresholds. This catches configuration errors or abuse patterns.
Common Pitfalls in Continuous Integration (and How to Avoid Them)
Even high-performing engineering teams stumble when scaling CI. Most problems don’t come from tools; they come from how teams measure, automate, and operate their pipelines. These are the pitfalls that quietly slow delivery, inflate costs, and create instability.
Tracking Too Many Metrics – Collecting every metric leads to dashboard overload and noise; focus on a small set of goal-driven KPIs, separate core metrics from supporting ones, and retire metrics that don’t influence decisions.
Optimizing Metrics Instead of Outcomes – Chasing better numbers (coverage, deployments) without improving quality or speed causes “dashboard theater”; tie metrics to actionable behaviors, ask what each metric triggers, and prioritize outcomes over numbers.
Ignoring Leading Indicators – Focusing only on lagging metrics like escaped defects or MTTR hides early warnings; track build duration, queue time, and flaky tests, and use these signals to prevent downstream failures.
Treating CI as a Developer-Only System – CI issues often cross Dev, SRE, QA, and security, but unclear ownership slows resolution; assign shared accountability, give each role relevant visibility, and review CI health in leadership discussions.
Letting Flaky Tests Become Normalized – Nondeterministic tests erode trust, causing developers to ignore failures; automatically quarantine flaky tests, enforce strict triage SLAs, and treat test reliability as a core quality metric.
Over-Reliance on Manual Steps – Manual approvals and deploys make CI slow and unpredictable; automate repeatable tasks, remove non-essential gates, and leverage feature flags or gradual rollouts to de-risk changes.
Poor Visibility Into Pipeline Costs – Over-provisioned runners and redundant jobs spike costs and slow builds; track cost per build/minute, right-size runners, scale compute on demand, and eliminate low-value tests.
Failing to Evolve Metrics as Teams Grow – Metrics that worked for small teams can become blockers at scale; revisit KPIs regularly, adjust metrics with team maturity, and add/remove metrics aligned with evolving goals.
Improve Your Continuous Integration Process With Entelligence AI
Engineering teams waste countless hours on manual code reviews, tracking sprint progress across multiple tools, and trying to understand why builds keep failing. The problem is that traditional CI/CD tools give you metrics without context, data without insights, and dashboards that show what happened but not why it matters.
Entelligence AI transforms your entire engineering workflow from code review to team performance analytics. Instead of stitching together data from GitHub, Jenkins, Jira, and five other tools, you get unified visibility into what's actually slowing your team down and how to fix it.
Here's what Entelligence delivers:
AI-powered code review directly in your IDE – Catch bugs, security vulnerabilities, and quality issues in real time. Reduce review cycles and fix problems while the context is fresh.
Comprehensive CI/CD metrics in one dashboard – Track build performance, test coverage, deployment frequency, and DORA metrics without juggling multiple tools. See exactly how your engineering activity impacts business outcomes.
Security scanning built into your workflow – Detect vulnerabilities, exposed secrets, and dependency risks automatically during CI runs. Get clear remediation guidance so you focus on what matters.
Automated sprint assessments – Generate retrospectives and performance overviews from real data. Stop manually tracking progress or chasing updates from your team.
Team and individual insights that drive growth – Analyze commits, PR activity, code review participation, and contribution patterns. Identify top performers, recognize achievements, and support developers who need coaching.
Always-up-to-date documentation – AI-generated architecture diagrams, API docs, and code explanations that evolve with your codebase. Onboard new developers 3x faster with accurate, current docs.
With Entelligence AI, your CI/CD pipeline becomes smarter, faster, and more actionable, so you can focus on building great software, not wrangling data.
Conclusion
Tracking the right continuous integration metrics gives you the clarity needed to optimize your pipeline, reduce failures, and accelerate software delivery. By measuring performance, reliability, and quality, you can turn raw data into actionable insights that drive real improvements for your team.
Entelligence AI helps you put these insights into action by providing unified CI/CD metrics, AI-powered code reviews, automated sprint assessments, and real-time dashboards. This gives you a single view of your engineering workflow, so you can focus on solving problems instead of juggling multiple tools.
Start your free 14-day trial of Entelligence AI today and see how it can streamline your CI/CD process while improving team performance.
FAQ’s
1. What trends are shaping the future of CI/CD pipelines?
AI-driven automation, cloud-native pipelines, observability tools, and increased emphasis on security and compliance are shaping CI/CD, enabling faster, safer, and more efficient software delivery across industries.
2. Which DevOps tools are commonly used for continuous integration (CI)?
Popular CI tools include Jenkins, GitLab CI, CircleCI, and Travis CI, which provide automated builds, tests, and integrations to streamline development and maintain high code quality.
3. Can CI/CD pipelines reduce environmental impact?
Optimized CI/CD pipelines reduce wasted compute resources through parallel builds, caching, and auto-scaling, minimizing energy consumption while supporting faster development and deployment cycles.
4. What role does observability play in modern CI/CD?
Observability tools provide real-time insights into pipeline performance, error rates, and infrastructure health, helping teams proactively detect bottlenecks and optimize delivery without guesswork.
5. What are the 7 C’s of DevOps?
The 7 C’s include Culture, Collaboration, Communication, Continuous Integration, Continuous Delivery, Continuous Testing, and Continuous Monitoring, framework principles guiding effective DevOps practices across teams and tools.