


How to Improve MTTR: 7 Proven Strategies for Faster Incident Response
Every minute of downtime costs more than most engineering leaders realize. According to a report, 98% of organizations say a single hour of downtime costs over $100,000, and 81% report losses above $300,000.
If your team is struggling with slow detection, unclear ownership, or lengthy troubleshooting cycles, you’re not alone; many IT and DevOps teams report MTTR far higher than they consider acceptable.
Improving MTTR is about strengthening visibility and eliminating bottlenecks throughout the incident lifecycle. If you’re looking for how to improve MTTR, the path starts with better detection, faster diagnosis, and streamlined recovery workflows.
In this article, we’ll break down why MTTR stays high, the metrics that matter, practical strategies to improve MTTR, and the tools you can use to recover faster.
Key Takeaways
Improving MTTR means adopting a holistic approach with faster detection, efficient workflows, strong documentation, and structured post-incident learning.
Observability, automated incident response, and AI-driven tools significantly reduce diagnosis and resolution times.
Clear communication, cross-team collaboration, and standardized runbooks prevent delays and duplicated efforts during incidents.
Tracking MTTR and related metrics like MTTD, MTTK, and MTBF reveals bottlenecks and guides targeted improvements.
What MTTR Actually Means (With Simple Examples)
Mean Time to Repair (MTTR) measures the average time it takes to restore a failed system to full operational status. This metric tracks the complete lifecycle from the moment a failure is detected until the system is verified as working correctly again.
The basic formula:
MTTR = Total Downtime for All Incidents / Number of Incidents
Let's break this down with a real scenario. Your team experienced five incidents last month:
Incident 1: Database connection pool exhaustion (2 hours)
Incident 2: Memory leak in payment service (4 hours)
Incident 3: API rate limit misconfiguration (1 hour)
Incident 4: Redis cache cluster failure (3 hours)
Incident 5: CDN origin server timeout (5 hours)
Calculation:
MTTR = (2 + 4 + 1 + 3 + 5) / 5 = 15 / 5 = 3 hours
Your average repair time is 3 hours per incident.
MTTR isn't just one thing. The acronym can mean different variations depending on what aspect of the incident lifecycle you're measuring:
Mean Time to Repair: Complete fix and verification.
Mean Time to Respond: From detection to starting work
Mean Time to Recover: Returning to basic functionality
Mean Time to Resolve: Implementing a permanent fix
For most engineering teams, MTTR encompasses the entire period from when an incident begins affecting users until normal service is fully restored. This includes detection time, diagnosis, implementing fixes, testing, and verification.
A lower MTTR indicates your team can bounce back from failures quickly, minimizing the impact on users and the business. It's a window into how well your systems and processes handle inevitable shortcomings.
MTTR vs Related Metrics
Many teams struggle to distinguish between MTTR and other incident response metrics. Each one tracks a different phase of the incident lifecycle, and understanding these distinctions helps you identify exactly where delays occur.
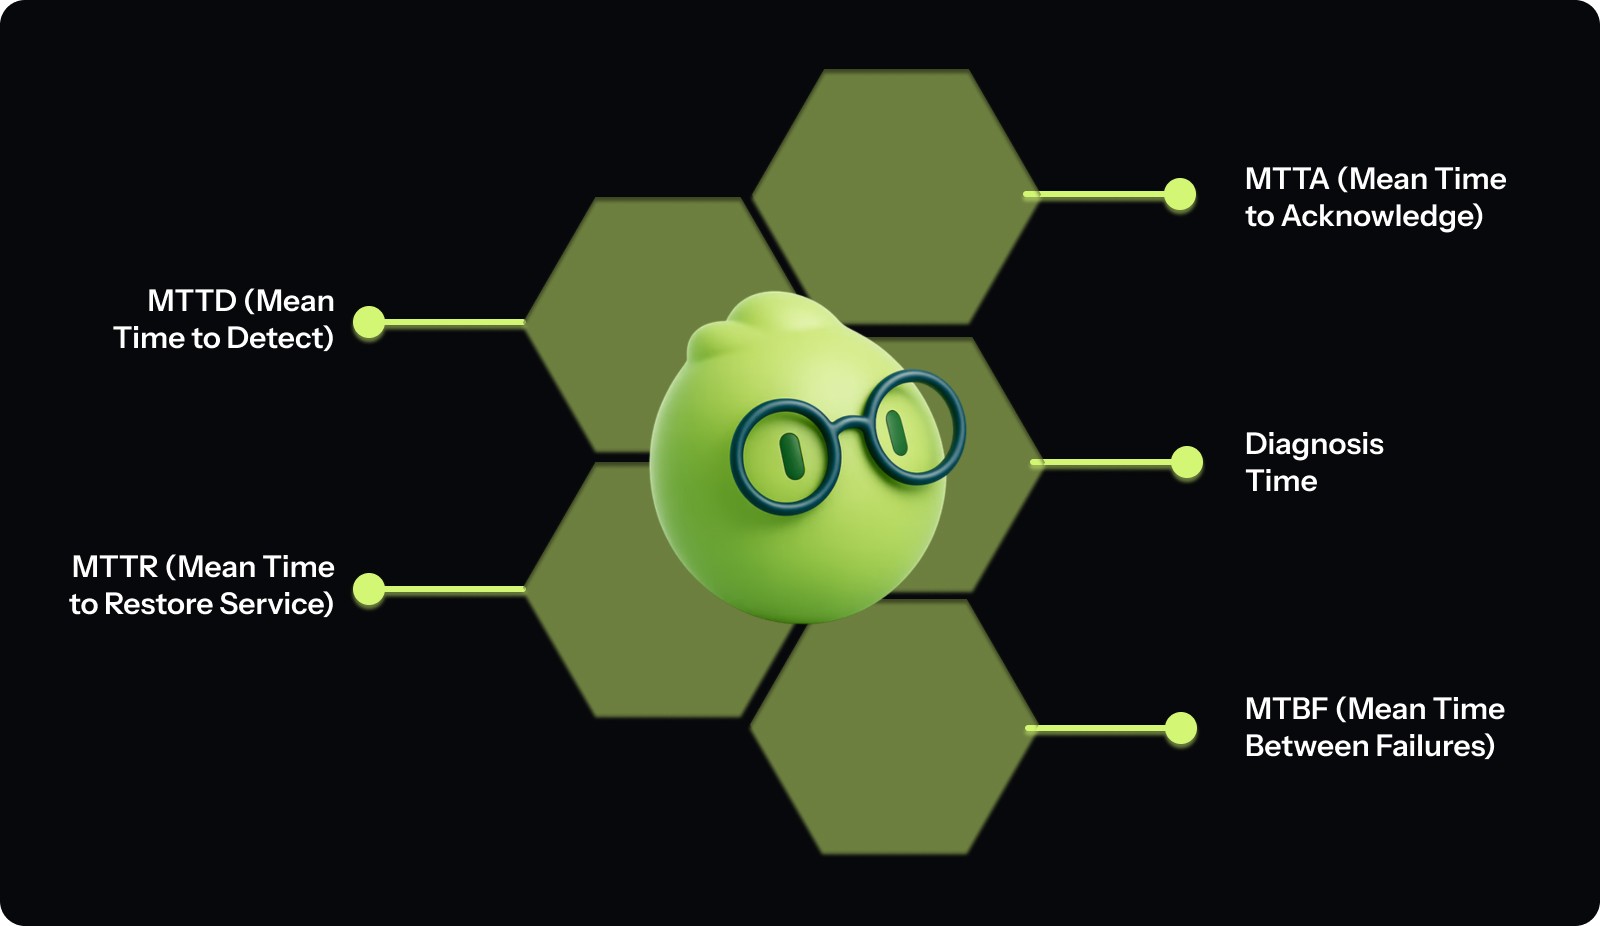
Here's how MTTR relates to other key metrics in the incident response ecosystem. Use these metrics to pinpoint where time is lost:
1. MTTD (Mean Time to Detect)
MTTD measures how long it takes for your systems to detect a failure and raise an alert. It covers the period between when an issue begins and when monitoring systems surface it.
Example: A memory leak starts degrading service at 3:00 PM, but alerts only fire at 3:20 PM when error rates cross the threshold.
MTTD = 20 minutes
High MTTD usually points to gaps in observability, delayed alert thresholds, or insufficient instrumentation.
2. MTTA (Mean Time to Acknowledge)
MTTA measures how long it takes for a human to acknowledge an alert and take ownership of the incident. This reflects on-call responsiveness and alert routing quality.
Example: An alert fires at 2:10 AM, but the on-call engineer acknowledges it at 2:18 AM.
MTTA = 8 minutes
If MTTA is high, alerts may be noisy, unclear, or reach the wrong responders.
3. Diagnosis Time
Diagnosis Time captures the period between acknowledgement and understanding what’s actually wrong. This is when engineers investigate logs, review dashboards, correlate events, and identify the likely root cause or fix path.
Example: An alert is acknowledged at 4:00 PM, but the team identifies a faulty deployment as the cause at 4:32 PM.
Diagnosis Time = 32 minutes
Long diagnosis times often indicate scattered telemetry, outdated documentation, or complex service dependencies.
4. MTTR (Mean Time to Restore Service)
MTTR measures the total time from when users are impacted until service is fully restored. It includes detection, acknowledgement, diagnosis, mitigation, rollback, and verification.
This is the most widely tracked recovery metric and is included as a core reliability indicator in frameworks like DORA.
Example: A customer-facing outage begins at 1:45 PM, and service is fully restored at 3:15 PM.
MTTR = 1 hour 30 minutes
Lower MTTR means faster recovery and reduced user and business impact.
5. MTBF (Mean Time Between Failures)
MTBF measures reliability rather than response speed. It tracks how long, on average, it takes for incidents to occur.
Example: Your API experiences failures on January 5, January 20, and February 3.
MTBF = 14.5 days between failures
A team can have low MTTR but still face frequent incidents if MTBF is low.
How These Metrics Fit Together
Failure starts → Detected (MTTD) → Acknowledged (MTTA) →
Diagnosed → Service restored (MTTR)
← Time between failures (MTBF) →
If MTTR is high, break it down by phase: detect, acknowledge, diagnose, recover, and focus improvements on the slowest link instead of trying to improve everything at once.

Common Reasons for High MTTR
A single failure rarely causes high MTTR. It typically results from a combination of system complexity, visibility gaps, and slow engineering workflows that make detection, diagnosis, and recovery harder than they should be.
Below are the most common factors that consistently increase MTTR across modern engineering teams:
Limited Observability & Monitoring Coverage: Incomplete logs, missing traces, or inconsistent metrics force engineers to search for data rather than diagnose the issue.
Alert Noise & Poor Signal Quality: Low-quality or noisy alerts bury critical signals, delaying acknowledgment and prioritization.
Unstandardized or Inefficient Incident Response: Lack of clear runbooks, escalation paths, and defined roles turns each incident into an ad hoc coordination exercise.
Distributed Systems & Service Sprawl: Interconnected microservices make root cause analysis slower and more complex.
Slow or Bottlenecked Engineering Workflows: Even after identifying the issue, fixes stall due to slow PR reviews, unclear ownership, overloaded reviewers, or missing context.
Outdated or Unreliable Documentation: Stale diagrams, missing runbooks, and incomplete API or system documentation extend diagnosis and recovery times.
Communication Breakdowns During Incidents: Fragmented context across Slack, tickets, and calls leads to duplicated work and slower decision-making.
Release & Deployment Issues: Poorly tested changes, missing automated rollbacks, or slow pipelines delay recovery, mainly when incidents stem from regressions or configuration errors.
Knowledge Silos & Single Points of Expertise: When only a few engineers understand key subsystems, MTTR hinges on individual availability.
Weak Post-Incident Learning Loops: Post-mortems that don’t translate into concrete improvements allow recurring incident patterns and persistent MTTR.
How To Improve MTTR? 7 Proven Strategies
Lowering MTTR requires more than better tools. To improve MTTR, treat incident response as an interconnected system that depends on fast detection, efficient knowledge sharing, and strong post-incident learning.
Let’s look at the top 7 strategies on how to improve MTTR in detail:
1. Implement Comprehensive, End-to-End Observability
Fast recovery starts with knowing exactly what is failing and why. Systems today are distributed and interconnected, so partial visibility is not enough. Observability is about collecting and correlating metrics, logs, traces, and events across all services.
Here’s how to get it right:
Instrument all services with distributed tracing to track requests across multiple microservices.
Monitor both technical KPIs (latency percentiles, error budgets, saturation indicators) and business metrics (checkout success rates, API failures, user session drops).
Correlate traces with deployment events to quickly identify change-driven incidents.
Use SLO-based alerting to focus engineers on user-impacting degradations, not every minor fluctuation.
Review detection gaps regularly and expand instrumentation to cover blind spots.
2. Automate and Standardize Incident Response Workflows
Manual incident workflows slow teams down and create room for errors. Consistent, repeatable processes help everyone act fast during SEV-1 or SEV-2 events.
Steps to implement:
Automatically create war rooms and incident tickets when high-severity alerts fire.
Auto-populate incidents with deployment diffs, runbook links, logs, and recent error spikes.
Standardize severity definitions, escalation paths, and communication intervals.
Integrate rollback and traffic-shifting strategies for unhealthy releases.
Conduct quarterly reviews of workflows to remove friction and outdated steps.
3. Build High-Fidelity Documentation and Cross-Team Knowledge Systems
A huge portion of MTTR is spent searching for context, such as who owns a service, its dependencies, or recent changes. Accurate, updated documentation directly reduces diagnosis time.
To achieve this:
Maintain architecture diagrams, dependency graphs, and service ownership maps.
Version-control runbooks with troubleshooting steps and recovery instructions.
Capture post-incident knowledge in searchable repositories.
Use tools like Entelligence AI to automatically generate up-to-date documentation and PR insights, so responders never have to start from scratch during incidents.
4. Streamline Communication and Decision-Making During Incidents
Outages are as much a people problem as a technical one. Poor communication creates duplicated work and wasted time.
Best practices:
Automatically create dedicated incident channels for each event.
Define clear roles: Incident Commander, Technical Lead, Communications Lead, and Scribe.
Share stakeholder updates at predictable intervals to reduce interruptions.
Maintain a centralized timeline logging actions, hypotheses, and findings.
Run post-incident reflections to refine roles and improve team coordination.
5. Optimize Alerting Hygiene and Signal-to-Noise Ratios
Noisy or vague alerts make teams slower. If engineers ignore pages because of irrelevant signals, real incidents take longer to resolve.
Implementation tips:
Tune thresholds using historical baselines rather than fixed numbers.
Use multi-condition alerts (for example, latency, saturation, and error spikes together).
Suppress alerts during planned maintenance.
Conduct monthly reviews to remove low-value alerts and false positives.
Align alerts with service-level objectives so responders focus on user-facing impact.
6. Apply Predictive Analytics and AI-Driven Anomaly Detection
Modern systems generate more telemetry than humans can manually analyze. AI helps detect subtle issues early, reducing MTTR.
How to apply this:
Train models to learn normal service behavior and detect deviations.
Surface anomalies that do not cross hard thresholds but indicate potential failure modes.
Correlate metrics, logs, traces, and deployments automatically to pinpoint root causes.
Prioritize anomalies based on known high-risk behaviors or critical services.
AI-based anomaly detection can surface weak signals earlier (like slow error-rate drift or abnormal memory growth), giving you time to intervene before a full outage.
7. Strengthen Change and Release Management to Reduce Incident Volume
Deployments, configuration updates, or schema changes cause a significant portion of MTTR. Improving release practices reduces the number of incidents and, by extension, MTTR.
Key practices:
Use progressive delivery strategies like canary, blue-green, or shadow deployments.
Tie automated tests to error budgets and release gates.
Track deployments and correlate code changes with downstream failures.
Implement rapid rollback mechanisms without requiring full redeployment.
Use feature flags to decouple releases from user-facing changes.
Implementing these strategies will help your team reduce MTTR, accelerate incident recovery, and strengthen overall system reliability.
A Runbook Mini-Template to Reduce MTTR
Even with strong observability and tooling, teams lose time during incidents when there’s no shared structure for action. A lightweight, standardized runbook helps responders move from alert to resolution without hesitation or duplicated effort.
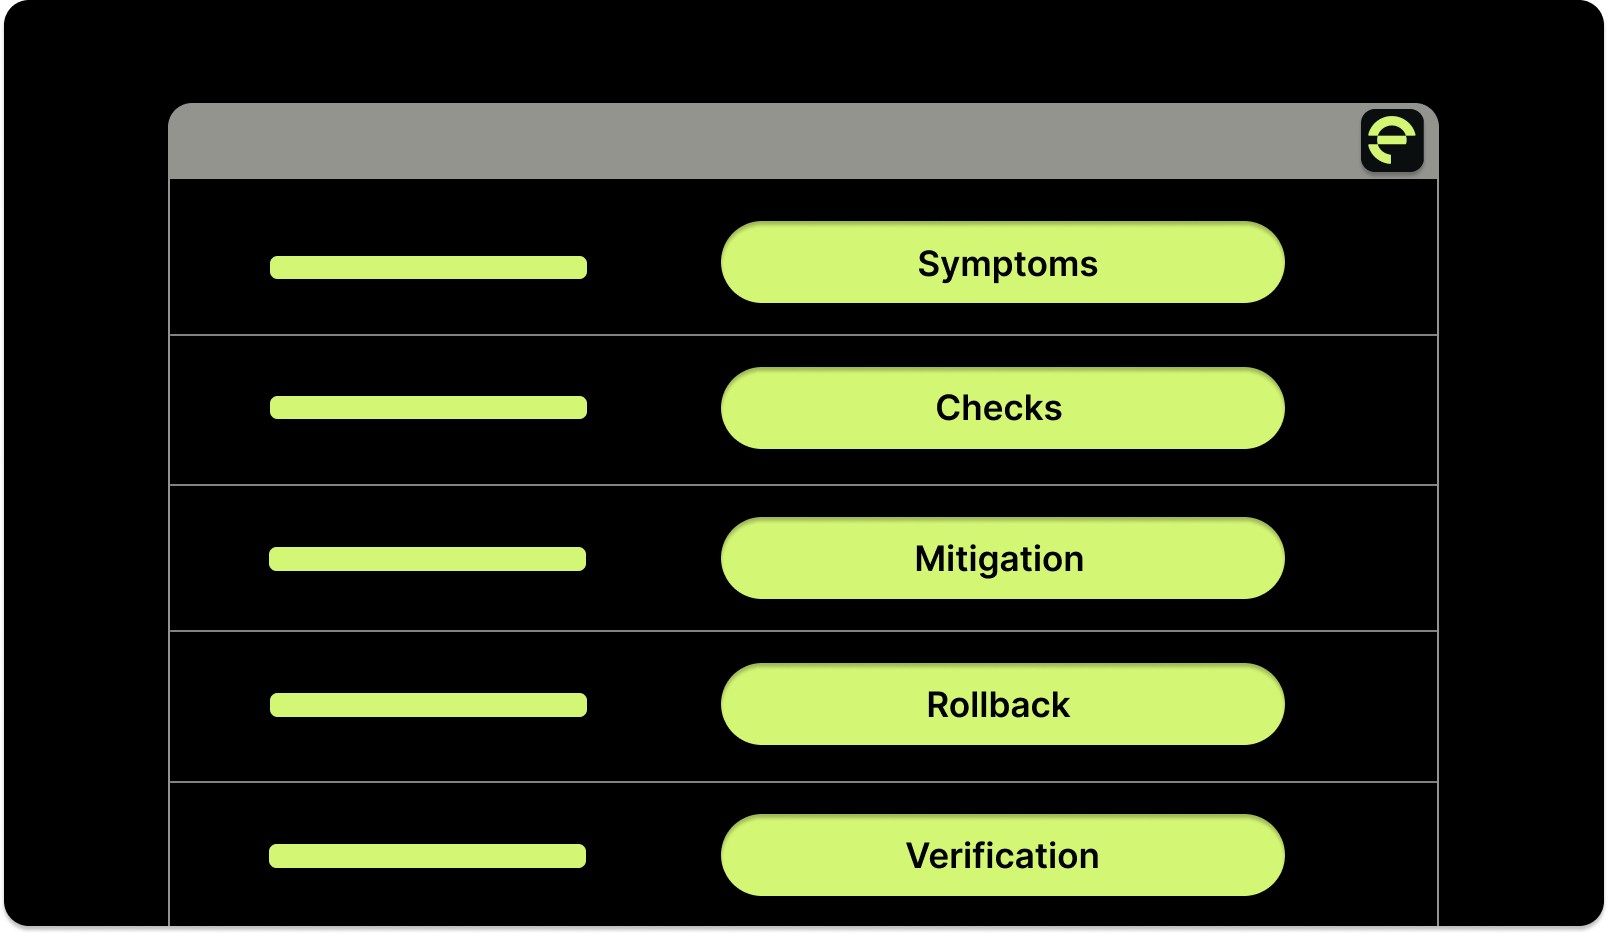
Use the following mini-template as a starting point. It’s intentionally concise so teams can apply it during high-pressure incidents.
1. Symptoms (What’s Broken and Who’s Affected)
Document the observable impact first to align everyone on severity and scope.
Alerts triggered and dashboards showing degradation.
Impacted services, APIs, or user journeys.
Customer-facing symptoms (errors, timeouts, performance drops).
Time of first detection and how the issue was discovered.
Outcome: Shared understanding of impact and urgency.
2. Checks (How to Diagnose Quickly)
Focus on fast signal gathering before deep investigation.
Relevant logs, traces, and metrics to inspect.
Recent deployments, configuration changes, or feature flag updates.
Dependency health (databases, queues, third-party services).
Known failure modes or similar past incidents.
Outcome: Narrowed hypothesis and reduced time-to-understand (MTTK).
3. Mitigation (How to Reduce User Impact Fast)
Stabilize the system before pursuing a permanent fix.
Throttle traffic or reroute requests.
Disable risky features using feature flags.
Scale resources temporarily or apply safe configuration changes.
Apply partial fixes that reduce blast radius.
Outcome: User impact contained while deeper fixes are prepared.
4. Rollback (How to Reverse Changes Safely)
If the incident is change-driven, rollback must be fast and predictable.
Revert recent deployments or configuration updates.
Restore last known-good versions.
Confirm rollback completion across all environments.
Communicate rollback status to stakeholders.
Outcome: Rapid recovery to a stable baseline.
5. Verification (How to Confirm Full Recovery)
Ensure the system is genuinely healthy before closing the incident.
Key SLOs and error rates return to normal.
Latency, throughput, and saturation stabilize.
No new alerts or regressions appear.
User-facing functionality verified.
Outcome: Incident resolved with confidence, not assumption.
Implementation Tip: Link this runbook directly from alerts, incident tickets, and war-room channels. Teams should never have to search for “what to do next” during an outage.

Essential Tools to Improve MTTR
Choosing the right tools can help you detect issues faster, understand root causes clearly, and resolve incidents efficiently.
Let’s have a look at some of the top tools you can use to help improve MTTR.
Tool | Primary Function | How It Helps You Reduce MTTR | Key Implementation Tips |
AI-powered code review, automated documentation, and team insights. | Prevents incidents before they reach production, ensures your runbooks and PR notes are always up to date. | Integrate with CI/CD pipelines for automated code checks; generate post-deployment documentation automatically to speed future troubleshooting. | |
Datadog | Full-stack observability with metrics, logs, and traces | Provides real-time visibility into infrastructure and application health, enabling faster detection and diagnosis. | Set up service-level dashboards and alerts; use distributed tracing to identify failing service calls across microservices. |
New Relic | Application performance monitoring with distributed tracing. | Helps quickly pinpoint the root cause of performance issues. | Use transaction traces to identify slow endpoints and error hotspots; tie traces to deployments to detect change-driven issues. |
Prometheus + Grafana | Open-source monitoring and visualization | Customizable metrics collection and visualization for infrastructure and applications | Tune alert thresholds to reduce false positives; build dashboards for both technical and business metrics. |
PagerDuty | Incident management and on-call orchestration | Ensures the right team members are notified instantly, reducing response delays | Configure escalation policies and automatic scheduling; integrate with monitoring tools to trigger alerts automatically. |
Opsgenie | Alert management and incident coordination. | Centralizes alerts and coordinates response across teams. | Use alert enrichment to provide context; group related alerts to prevent overload; integrate with communication tools. |
Rootly | AI-driven incident workflows | Automates repetitive incident response steps, letting you focus on diagnosis and resolution. | Configure automated runbooks for common failure scenarios; integrate with your ticketing and alerting systems. |
Tips to get the most value:
Look for tools that integrate smoothly with your CI/CD pipelines, monitoring, and incident management platforms.
Prefer platforms that reduce context switching, use centralized dashboards, and automate workflows to save critical minutes.
Automate what can be automated (like documentation, alert enrichment, and routine incident steps), so your team can focus on problem-solving.
Continuously review which tools actually improve response efficiency in your environment and adapt usage accordingly.
Entelligence AI: Your Partner to Improve MTTR and Team Productivity
High MTTR often stems from poor visibility into what changed, why it broke, and how to fix it quickly. Manual incident tracking wastes time. Scattered information slows diagnosis. Teams lose hours just trying to understand what went wrong.
Entelligence AI connects incident response with your entire engineering productivity stack. Instead of manually piecing together what happened, you see the full context automatically based on actual code changes and deployment history.
Here's how Entelligence AI helps engineering teams reduce MTTR:
Context-rich code reviews that prevent production issues: AI-powered code review catches bugs, security vulnerabilities, and anti-patterns before they reach production. When incidents do occur, review history provides immediate context about what was modified and why.
Unified PR and deployment dashboards: Gain instant visibility into all pull requests across repositories. Instead of digging through Git history during an incident, immediately see what changed, who changed it, and correlate it with system behavior.
Automated documentation that stays current: Automatically generated architecture diagrams, code explanations, and API documentation stay up-to-date as systems evolve. During incidents, quickly reference accurate architecture diagrams to understand service dependencies.
Team and individual insights for capacity planning: Visibility into workload distribution, PR review patterns, and contributor activity helps identify when teams are overloaded. Prevent the fatigue that slows incident response and see who has expertise in which areas for faster escalation.
Sprint health and velocity tracking: Automated sprint assessments surface blockers, delays, and quality issues that might lead to rushed deployments. Identify problems early to address quality concerns before they become production fires.
Security dashboard for proactive risk management: Continuous vulnerability scanning identifies security issues before they are exploited. Remediation guidance appears directly in the IDE, preventing the security incidents that often have the longest resolution times.
AI-powered background automation: Automate repetitive tasks like linting, formatting, and boilerplate generation. During incident response, engineers focus on solving complex problems rather than manual tasks.
Entelligence AI turns incident response from a chaotic scramble into a structured, context-rich process. You get faster resolution times without the overhead that usually slows teams down.
For example, Digibee merged 191 PRs in 2 months without a single production defect by using Entelligence AI to catch critical issues before deployment. This is precisely how you can prevent incidents at the source, dramatically reduce MTTR, and maintain system stability.
Conclusion
Improving MTTR starts with taking a holistic approach to incident response. By investing in comprehensive observability, rigorous change management, automation, and structured post-incident learning, you can systematically reduce downtime and its impact on users.
The strategies we’ve covered are practical steps you can implement today to see real improvements. Start by measuring your current baseline, identifying bottlenecks, and iterating on processes. Small, consistent improvements compound into significant gains over time.
Entelligence AI helps you accelerate this journey by providing end-to-end visibility, automated documentation, and intelligent workflows across your engineering lifecycle. With Entelligence, you can catch issues earlier, respond faster during incidents, and continuously improve your team’s reliability.
Ready to see how to improve MTTR for your team? Book a demo with Entelligence AI today and transform the way your engineering team handles incidents.
FAQ’s
1. How long should it take to resolve a production incident?
Resolution time depends on severity and business impact. Critical SEV-1 incidents aim for 15–30 minutes, SEV-2 incidents aim for under 2 hours, and less critical issues typically aim for 4–8 hours, tracked over time.
2. What's the difference between MTTR and MTBF?
MTTR measures how fast you recover after failures. MTBF measures how often failures happen. You can have a low MTTR but still suffer frequent incidents if MTBF is low—so you need both: faster recovery and fewer regressions.
3. How do you reduce MTTR for complex microservices architectures?
Use distributed tracing, service mesh observability, comprehensive service catalogs, feature flags for instant rollback, and clear service ownership with documented runbooks to streamline detection, diagnosis, and recovery.
4. Should we prioritize faster detection or faster resolution?
Prioritize based on bottlenecks: improve detection if alerts lag, enhance resolution if diagnosis stalls. Most teams benefit from optimizing detection first, then streamlining resolution workflows.
5. How do AI tools help reduce MTTR?
AI shortens MTTR by detecting anomalies early, correlating events, filtering noise, predicting failures, suggesting root causes, and preventing incidents with automated code review insights.