


Sprint Efficiency: How to Measure, Improve, and Scale Delivery
Your team commits to 50 story points every sprint. By day 10, half the work is still stuck in “In Progress.” Sound familiar?
Most engineering teams treat sprints like promises, optimistic commitments made in planning meetings that quietly unravel midway through the sprint. The result is missed deadlines, stressed developers, and stakeholders who no longer trust estimates.
Sprint efficiency is what separates teams that consistently deliver from those that constantly scramble. Yet many teams struggle because they’re measuring the wrong things. According to the 2024 State of Agile Report, only 36% of teams use outcome-focused metrics beyond raw velocity to evaluate performance. That gap explains why so many sprints look successful on paper but fail in execution.
When you understand how to measure and improve sprint efficiency, you move from unpredictable delivery to reliable, repeatable outcomes.
In this guide, you’ll learn what sprint efficiency actually means, why it matters more than velocity, how to calculate it step by step, and the proven methods high-performing teams use to improve delivery without burning out their developers.
Key Takeaways
Sprint efficiency measures delivery reliability, not effort or velocity, making it a stronger indicator of whether teams consistently finish what they commit to.
Low sprint efficiency is usually caused by execution friction like scope creep, hidden capacity loss, workflow bottlenecks, and context switching, not poor developer performance.
Measuring sprint efficiency through completion rates, daily throughput (for capacity planning), and process efficiency reveals why work spills over and where delivery breaks down.
Improving sprint efficiency requires protecting the sprint scope, planning with real capacity, reducing wait times, and continuously managing technical debt.
What does Sprint Efficiency Actually Mean?
Sprint efficiency measures how reliably a team delivers on its commitments within a sprint. It focuses on delivery predictability, not effort, activity, or speed.
In simple terms, sprint efficiency compares planned work at the sprint start with work completed by the sprint end.
Sprint efficiency typically reflects:
How much committed work is finished within the sprint
How often does work spill over into the next sprint
How stable execution is once the sprint begins
It is commonly expressed as a ratio or percentage. For example, if a team commits to 40 units of work and completes 30, sprint efficiency is 75%.
However, it is essential to note that sprint efficiency is not:
It is not velocity, which measures output volume.
It is not team utilization or busyness.
It is not an individual performance score.
A team can deliver a high volume of work and still have low sprint efficiency if it regularly misses sprint commitments.
What makes sprint efficiency valuable is that it highlights delivery reliability. High sprint efficiency usually indicates realistic planning, controlled scope, and fewer execution blockers. Low sprint efficiency often points to overcommitment, mid-sprint changes, blocked work, or workflow delays.
Why Sprint Efficiency Is a Critical Agile Metric?
Sprint efficiency directly impacts your team's ability to deliver predictable results and maintain a sustainable pace. Here's why it matters more than most teams realize:
Sprint efficiency helps teams:
Forecast capacity more accurately by grounding sprint commitments in what teams consistently complete, not what they hope to deliver.
Surface hidden execution bottlenecks early, such as workflow friction, dependency delays, or increased complexity, before delivery issues escalate.
Prevent burnout and quality erosion by highlighting when output is maintained only through overtime or shortcuts rather than sustainable execution.
Build stakeholder confidence by demonstrating consistent follow-through on sprint commitments, improving trust in delivery timelines.
Enable data-driven improvement by providing a stable baseline to evaluate the impact of process, tooling, or planning changes.
Separate effort from outcomes, showing whether time spent during a sprint translates into completed, usable work.
Unlike velocity alone, sprint efficiency accounts for real-world variability across sprints, such as holidays, incidents, or changing scope. This makes it a more dependable signal for understanding delivery reliability over time.
Common Sprint Inefficiency Problems
Sprint inefficiency usually comes from systemic execution friction. The problems below are the most common patterns seen in mature US engineering teams.
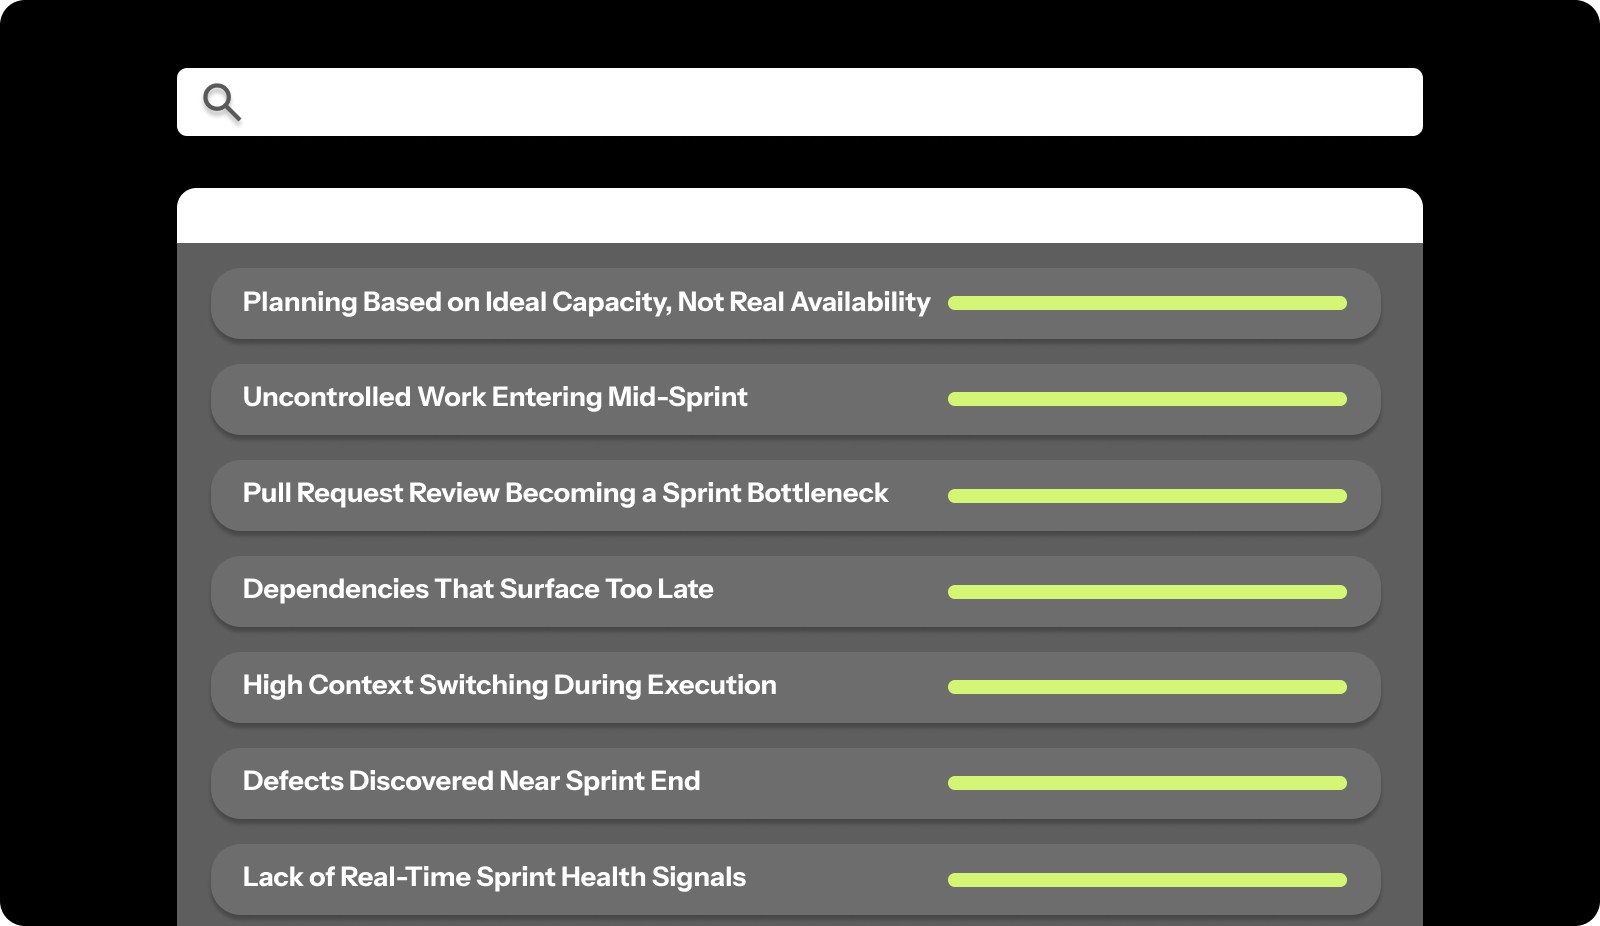
Planning Based on Ideal Capacity, Not Real Availability
Sprint commitments ignore PTO, on-call rotations, and incident response.
Capacity assumptions don’t reflect cross-team dependencies.
Teams consistently start sprints already overcommitted.
Uncontrolled Work Entering Mid-Sprint
Customer escalations or leadership requests override the sprint scope.
No clear trade-off decisions are made when new work is added.
Originally committed items are quietly pushed to the next sprint.
Pull Request Review Becoming a Sprint Bottleneck
Reviews are delayed due to unclear ownership or competing priorities.
Work completes late, creating end-of-sprint congestion.
Merge delays directly reduce the completion of committed work.
Dependencies That Surface Too Late
Work is planned without full dependency validation.
External approvals or shared services block progress mid-sprint.
Teams lose recovery time once blockers are identified.
High Context Switching During Execution
Engineers are pulled into meetings, support, and parallel initiatives.
Focus fragmentation slows progress on sprint-critical tasks.
Activity remains high while completion rates drop.
Defects Discovered Near Sprint End
Issues surface during final testing or integration.
Rework consumes remaining sprint capacity.
Teams sacrifice predictability to protect quality.
Lack of Real-Time Sprint Health Signals
Teams rely on sprint reviews to assess outcomes.
Risks are identified after commitments are already missed.
Corrective action happens one sprint too late.
These problems compound. Scope creep causes context switching. Poor estimation creates pressure to cut corners. Hidden time drains surprise you mid-sprint. Together, they turn manageable sprints into chaotic scrambles that drain team morale and stakeholder confidence.
Entelligence AI solves sprint efficiency problems before they derail your delivery. The platform provides real-time sprint insights that show exactly which stories are blocked, which developers need support, and whether you're on track to hit your commitments. Automated sprint assessments catch inefficiency patterns early, giving you time to course-correct instead of discovering problems in retrospectives. Book a free demo to see how it works in practice.

How to Measure Sprint Efficiency (Formula + Examples)
Understanding sprint efficiency starts with knowing your numbers. You need concrete data to measure how effectively your team converts sprint time into completed work.
Sprint Efficiency Formula
Sprint Efficiency = (Completed Story Points ÷ Committed Story Points) × 100
Example
If your team commits to 50 story points during sprint planning and completes 38 by the end of the sprint:
Sprint Efficiency = (38 ÷ 50) × 100 = 76%
A sprint efficiency of 70–80% typically indicates healthy planning and execution.
A reading below 60% signals consistent overcommitment or execution friction.
Above 90% often means the team is under-committing and leaving capacity unused.
This metric directly answers the most important sprint question: Did we deliver what we promised?
Daily Throughput Rate (Used for Capacity Planning)
While sprint efficiency measures reliability, teams still need a way to estimate how much work they can reasonably commit to in future sprints. That’s where daily throughput comes in.
Daily throughput measures average completed work per working day and should be used strictly for capacity forecasting, not as an efficiency metric.
Daily Throughput Formula
Daily Throughput = Total Completed Story Points ÷ Sprint Working Days
Example
If your team completes 38 story points over nine actual working days (after accounting for holidays or PTO):
Daily Throughput = 4.22 story points per day
You can use this number to guide future sprint commitments. For a 10-day sprint:
4.22 × 10 ≈ 42 story points
This helps teams plan realistically while keeping sprint efficiency focused on commitment reliability.
Now that you know how to calculate, let’s look at exactly how you can measure your sprint efficiency. Follow the steps to measure it correctly.
Step 1: Track completed work accurately
Only count work that meets your definition of done. A story that's "90% complete" doesn't count. Code that's written but not reviewed doesn't count. Features deployed to staging but not production don't count.
At the end, sum up the story points for all fully completed items. If you committed to 50 points and finished 38, your completed work is 38 points.
Step 2: Calculate actual working days
Don't use calendar days. Count the actual working days available to your team during the sprint. Subtract weekends, holidays, planned time off, and any known non-working days.
A two-week sprint typically has 10 working days (5 days × 2 weeks). But if there's a holiday, you have nine working days. If half your team takes a day off, count it as 8.5 working days.
Step 3: Compute Sprint Efficiency (Commitment Reliability)
At this stage, calculate how reliably your team delivered on its sprint commitment.
Compare the work completed by the end of the sprint with the work committed during sprint planning. The resulting percentage shows whether planning assumptions held up during execution.
Using our example, completing 38 story points out of a 50-point commitment results in 76% sprint efficiency.
Step 4: Track Daily Throughput and Compare Across Sprints
Next, look at daily throughput, which represents the team’s average completed work per actual working day. This metric should be used only for future capacity planning, not as a measure of efficiency.
In our example sprint, the team averaged 4.22 story points per working day.
Use this rate to guide future commitments, then review both sprint efficiency and throughput across three to five sprints to spot patterns:
Stable sprint efficiency in the 75–85% range indicates reliable delivery.
Consistent throughput supports predictable capacity planning.
Large swings in either metric usually point to scope creep, interruptions, or workflow bottlenecks.
When tracked together, these metrics separate delivery reliability from planning capacity, giving teams a clearer picture of what’s actually happening inside their sprints.
Process Efficiency: Real Work Time vs. Calendar Time
Process efficiency is defined as the actual time required to complete the job divided by the calendar time needed to complete the job. This measures how much of your sprint time actually goes toward completing stories, versus time spent waiting, blocked, or context-switching.
Formula:
Process Efficiency = (Real Work Time ÷ Calendar Time) × 100
Example:
A 5-point story takes 10 calendar days to complete, but analysis shows only 2 days of actual work time (coding, testing, reviewing). The remaining 8 days were spent waiting for reviews, blocked on dependencies, or interrupted by other priorities.
Process Efficiency = (2 ÷ 10) × 100 = 20%
Low process efficiency means stories sit idle more than they're being actively worked on. This signals workflow problems, too many handoffs, or insufficient focus time.
What the Numbers Tell You
Your efficiency metrics reveal specific problems:
High variance between sprints: Inconsistent scope creep, unpredictable interruptions, or poor capacity planning.
Low completion rates: Chronic over-commitment or inaccurate estimation.
Poor process efficiency: Workflow bottlenecks, excessive wait times, or fragmented focus.
Once you understand your current efficiency, you have a baseline for improvement. Every process change can be measured against this baseline to see if it actually helps.
What Good Sprint Efficiency Looks Like
Good sprint efficiency shows up as predictability and control. Teams with healthy sprint efficiency share a small set of consistent signals.
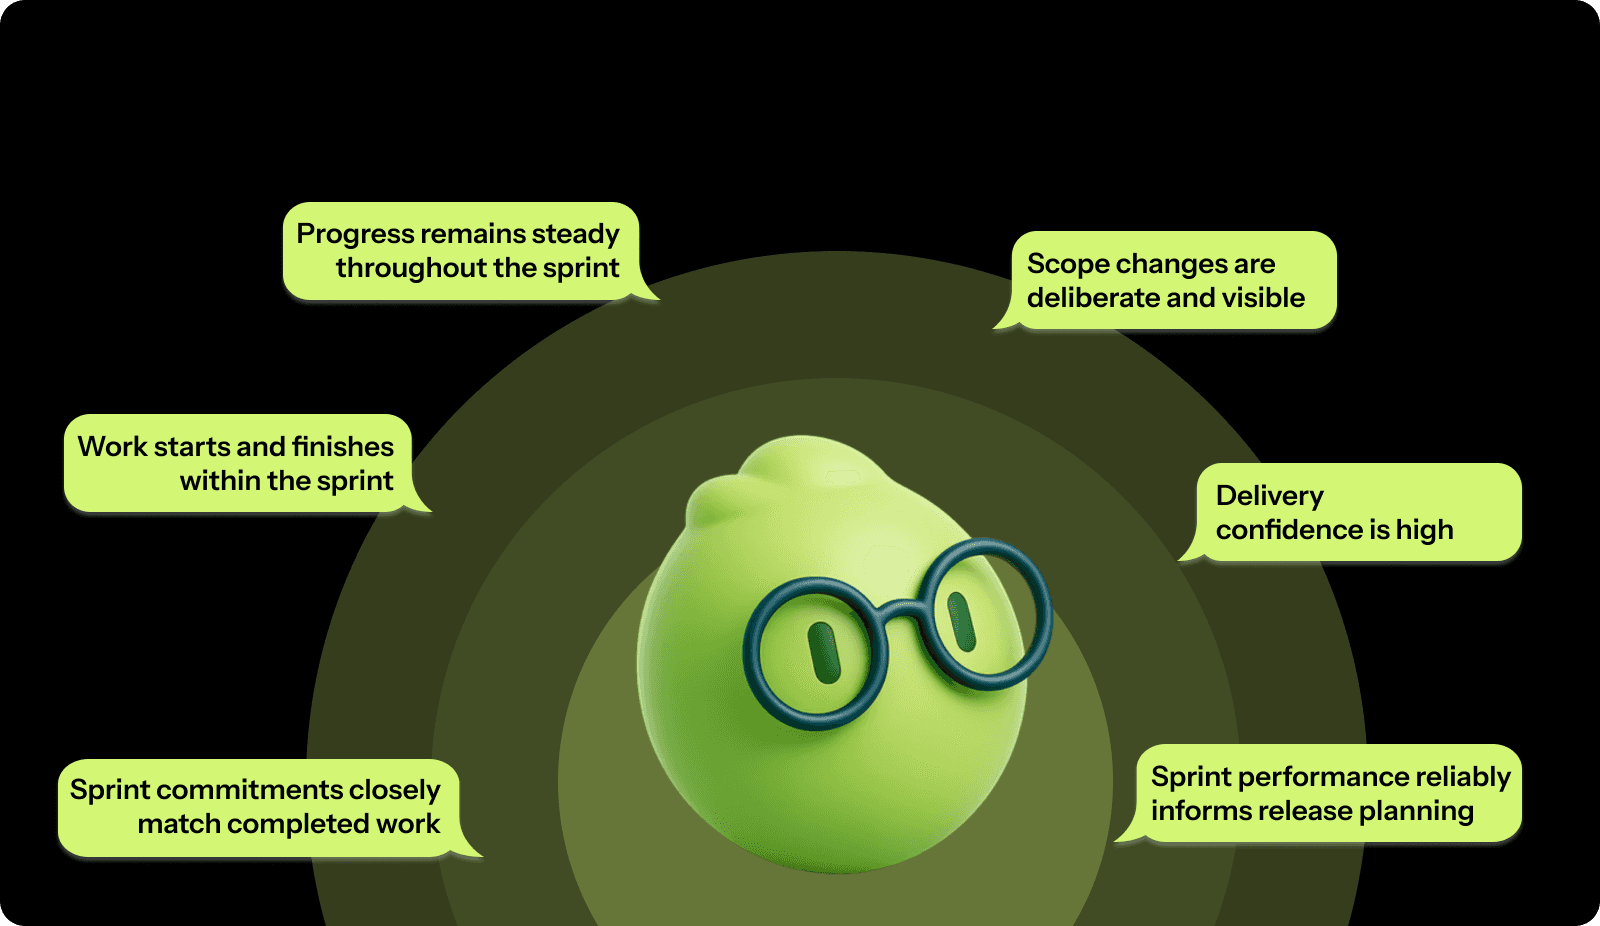
Sprint commitments closely match completed work across most sprints, with limited variance.
Work starts and finishes within the sprint, rather than being carried over repeatedly.
Progress remains steady throughout the sprint, not concentrated at the end.
Scope changes are deliberate and visible, not constant or reactive.
Delivery confidence is high among engineers and stakeholders.
Sprint performance reliably informs release planning.
These signals indicate that planning assumptions hold up during execution and that teams can correct course before delivery reliability breaks down.
Good sprint efficiency is all about making sprint outcomes dependable and repeatable over time.

How to Improve Sprint Efficiency?
Improving sprint efficiency requires systematic changes to how you plan, execute, and track work. These proven methods help teams move from chaotic, unpredictable sprints to consistent, efficient delivery.
Plan Capacity Based on Reality
Most teams overcommit because they plan as if developers code eight hours a day. In practice, meetings, reviews, support, and coordination consume nearly half that time.
High-efficiency teams plan using adequate capacity, not theoretical availability.
Key practices:
Reduce planned capacity to reflect meetings, support, and collaboration overhead.
Apply skill multipliers when planning (juniors ≠ seniors in throughput).
Reduce capacity during onboarding for both new hires and their mentors.
Reserve 15–20% buffer capacity for incidents, underestimation, and urgent work.
Actively Defend the Sprint Scope
Sprint efficiency drops fastest when new work enters without trade-offs. High-performing teams treat sprint scope as protected and force explicit decisions.
Key practices:
Require equal-sized work to be removed before new work is added.
Route urgent requests through a clear triage path.
Lock the sprint scope shortly before the sprint starts.
Track how much unplanned work enters each sprint and why.
Make Estimates Smaller and Comparable
Large stories destroy predictability. If work can’t be visualized clearly, it can’t be estimated reliably.
Efficient teams optimize for estimable work, not fewer tickets.
Key practices:
Split stories larger than 8 points into smaller, shippable units.
Use reference stories from previous sprints to anchor estimates.
Estimate as a team to surface hidden complexity early.
Include testing, review, documentation, and deployment in estimates.
Eliminate Context Switching at the Sprint Level
Teams often look busy while efficiency drops. The hidden culprit is context switching, too many parallel priorities competing for attention.
High-efficiency teams optimize for finishing work.
Key practices:
Limit developers to 1–2 active stories at a time.
Batch code reviews into dedicated time windows.
Create focus blocks with reduced Slack and meeting interruptions.
Assign a rotating “support” role to handle firefighting.
Protecting focus increases completion rates without increasing effort.
Remove Workflow Bottlenecks, Not People
Stories spend more time waiting than being worked on. Reviews, approvals, and dependencies quietly eat sprint capacity.
Efficient teams manage flow deliberately.
Key practices:
Set clear expectations for code review turnaround (same day, not “eventually”).
Keep pull requests small (large PRs slow everything down).
Automate checks so humans review logic, not formatting.
Identify recurring dependency delays and plan around them.
Reducing wait time improves efficiency faster than adding capacity.
Treat Technical Debt as a Velocity Tax
Technical debt increases estimation error, bug rates, and rework. Over time, it makes sprint planning unreliable.
High-performing teams pay down debt continuously.
Key practices:
Allocate 15–20% of sprint capacity to technical improvements.
Track debt that directly impacts delivery speed and stability.
Tie debt reduction to measurable outcomes (faster dev, fewer bugs).
Enforce quality gates to prevent new debt from accumulating.
Ignoring debt is choosing declining efficiency.
Use Efficiency Data to Drive Change
Sprint efficiency only improves when teams measure, test, and adapt.
Strong teams use data to validate process changes.
Key practices:
Review efficiency, spillover, and unplanned work in retrospectives.
Identify which changes improved or harmed delivery.
Run improvement experiments for 2–3 sprints before judging impact.
Reinforce practices that measurably improve predictability.
Efficiency compounds when improvement is intentional and measured.
How Entelligence AI Improves Sprint Efficiency?
Manual sprint tracking consumes hours your team doesn't have. Spreadsheets get outdated. Status meetings drag on. By the time you realize a sprint is off track, it's too late to fix it.
Entelligence AI turns sprint efficiency into an automated, data-driven system that runs in the background while your team focuses on building.
Here’s how Entelligence AI translates sprint efficiency principles into day-to-day execution.
Real-Time Sprint Insights Without Manual Updates
Entelligence AI connects directly to your development tools and automatically tracks progress.
The platform surfaces sprint health immediately:
Which stories are at risk of missing the sprint
Which developers are overloaded vs. underutilized
Where bottlenecks are forming in your workflow
How much unplanned work is creeping into the sprint
This real-time visibility lets you course-correct mid-sprint instead of discovering problems at the sprint review.
AI-Powered Sprint Assessments
After each sprint, Entelligence AI automatically generates comprehensive sprint assessments.
Sprint assessments include:
Completion rate and efficiency metrics.
Scope creep analysis and its impact.
Estimation accuracy for completed stories.
Team capacity utilization.
Blockers and delays that affected delivery.
These assessments replace manual retrospective prep. Your team walks into retrospectives with concrete data showing exactly what needs to improve.
Individual and Team Performance Analytics
Entelligence AI tracks performance at both team and individual levels. You see which developers consistently deliver high-quality work on time, who are struggling with estimates, and where coaching opportunities exist.
The platform shows:
PR velocity and code review turnaround times.
Bug fix rates and code quality trends.
Contribution patterns across the sprint.
Collaboration metrics and team dynamics.
This data helps you balance workload fairly and identify when someone needs support before they burn out or miss commitments.
Automated Documentation and Context Preservation
Context loss kills efficiency. Entelligence AI generates and maintains documentation automatically as code evolves. New developers are onboarded faster. Knowledge doesn't disappear when someone leaves. Your team spends less time figuring out what code does and more time improving it.
Documentation stays current without manual effort, reducing the hidden time drain of answering repetitive questions about how systems work.
Security and Quality Gates Built In
Security issues discovered late in the sprint destroy efficiency. Entelligence AI scans for vulnerabilities continuously and flags them early. Your team fixes security issues before they block deployment, not after they cause sprint delays.
The platform provides:
Continuous dependency vulnerability scanning.
Code security pattern detection.
Remediation suggestions in your IDE.
Severity-based alerts to leads.
Built-in quality checks prevent efficiency-killing rework from bugs and security issues found too late.
Leaderboards and Team Motivation
Entelligence AI gamifies sprint efficiency improvements. Leaderboards recognize developers who drive velocity, maintain code quality, and help teammates. This friendly competition keeps efficiency top of mind and makes improvement visible.
You can configure leaderboards to emphasize what matters: quality over quantity, helping others, and reducing bugs.
Integration with Your Existing Tools
Entelligence AI works directly in the IDEs your developers already use, Windsurf, VS Code, and Cursor. It connects with your project management tools, communication platforms, and documentation systems.
Everything runs in the background, collecting data and surfacing insights where your team actually works.
The platform delivers sprint efficiency without the cost of manual tracking. Your team gets the benefits of detailed performance data without spending time maintaining spreadsheets, running reports, or sitting through status meetings.
Real engineering teams are seeing results. Composio tripled their development speed while saving 100+ hours monthly by using Entelligence AI to catch critical code issues, automate documentation, and provide manager insights without extra meetings.
When you improve sprint efficiency with Entelligence AI, you free your team to focus on what they do best, building great software instead of tracking it.
Conclusion
Sprint efficiency separates teams that consistently deliver from teams that constantly struggle. When you measure efficiency correctly, tracking completion rate, daily story point output, and process efficiency, you get concrete data showing whether your sprints are actually working.
The common inefficiency problems are fixable. But manually tracking all these metrics takes up time you don't have. You need sprint efficiency without the efficiency cost of measuring it.
Entelligence AI automates sprint tracking, surfaces real-time insights, and generates automated, actionable assessments. Your team gets the clarity and data-driven improvements that drive efficiency without spending hours on manual reporting and status meetings.
Transform your sprints from unpredictable scrambles into reliable, efficient delivery cycles. Get started with Entelligence AI today.
FAQs
1. Does sprint efficiency work for Kanban or continuous delivery teams?
Yes. Track completed work over fixed time windows to measure delivery reliability and flow stability without using sprint commitments.
2. How does sprint efficiency relate to lead time and cycle time?
Sprint efficiency measures commitment reliability, while lead time and cycle time measure flow speed. Together, they show predictability and throughput health.
3. Can sprint efficiency be compared across different teams?
Only trends should be compared. Absolute efficiency varies by domain, team maturity, and work type, making cross-team benchmarks misleading.
4. How often should sprint efficiency targets be adjusted?
Review targets quarterly or after major team changes like staffing, scope shifts, or system complexity increases, not every sprint.
5. What are the 4 phases of a sprint?
The four phases of a sprint are planning, execution, review, and retrospective, helping teams align goals, deliver work, gather feedback, and improve future sprints.