


How Agile Metrics Improve Leadership Outcomes
Agile is becoming the standard for teams looking to work more efficiently and get things done faster. As more businesses adopt agile, tracking the right metrics is becoming essential for effective leadership.
Nearly 70% of respondents said IT and software development teams use Agile, and almost half of engineering, product, and R&D teams do the same. This shift shows just how important agile metrics are for leaders.
By tracking key metrics like velocity and cycle time, you can understand how your team is really doing, identify any roadblocks, and adjust as needed to keep everything on track. This helps your team stay focused and aligned with your business goals, driving better results along the way.
In this article, we’ll explore the essential agile metrics you should track to gain valuable insights that will help you lead your team to success.
Overview
Agile metrics are essential for leadership to make data-driven decisions, improve team performance, and align efforts with business goals.
Key metrics like velocity, lead time, and cycle time provide insights into team efficiency, capacity, and potential bottlenecks.
By tracking agile metrics, leadership can optimize workflows, allocate resources effectively, and continuously improve team processes.
Real-time insights into code quality, security, and team performance enable leadership to make informed decisions and drive strategic success.
Agile metrics should be used not just for tracking progress, but for facilitating continuous improvement and aligning team efforts with organizational objectives.
Why Agile Metrics Matter for Leadership?
Agile metrics are essential for strategic decision-making. It helps you align your team’s efforts with the broader objectives of the organization.
For you as a leader, agile metrics give you the clarity and foresight you need to make informed decisions. Real-time data lets you anticipate bottlenecks, adjust priorities, and optimize resources to improve your team’s performance.
Additionally, agile metrics act as the foundation for forecasting and setting realistic expectations across your team.
Benefits for Leadership:
Visibility and Transparency: Metrics allow you to see clearly where your team is excelling and where they may be facing challenges. With this visibility, you can intervene early to address any issues.
Continuous Improvement: By regularly reviewing these metrics, you can identify patterns and improve processes over time, a cornerstone of the agile philosophy.
Effective Resource Allocation: Metrics enable you to allocate your team’s resources more effectively. This ensures you focus on high-impact tasks or address skill gaps when needed.
With these benefits in mind, agile metrics let you make informed decisions that enhance team performance and drive strategic success. Now that we’ve explored why agile metrics are essential for leadership, let’s dive into the essential metrics you must track to gain actionable insights.
Also Read: Decoding Source Code Management Tools: Types, Benefits, & Top Picks
The Essential Agile Metrics Every Leader Must Track
As an agile leader, your job isn’t just to look at progress but to understand your team’s health, the efficiency of your processes, and the predictability of future deliveries. Here are the essential metrics that will give you actionable insights:
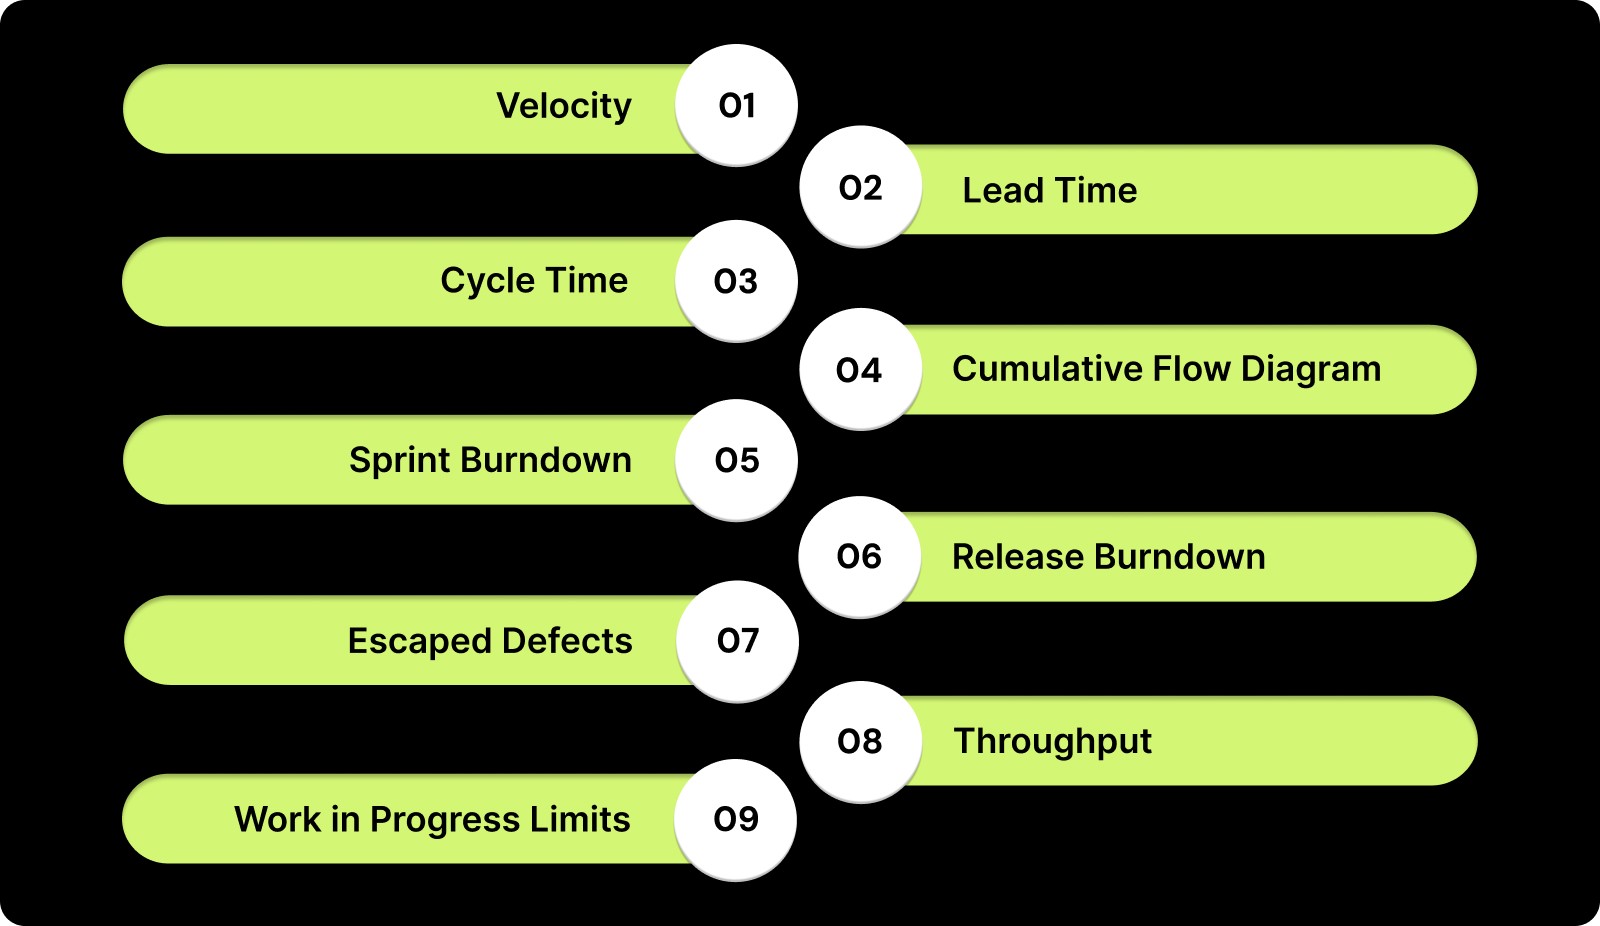
1. Velocity
Velocity measures the rate at which your team completes work in a sprint. It’s one of the most important metrics for predicting your team's future capacity and ensuring that you can meet delivery deadlines.
When to Use:
Sprint Planning: Use velocity to gauge how much work your team can realistically handle in upcoming sprints.
Release Management: Velocity helps you ensure that the release schedule aligns with the team’s capabilities.
How to Track: To track velocity, measure the total number of story points or work items completed in each sprint. You can track your team’s average velocity over time to identify trends.
Best Practices: Instead of comparing your team’s velocity to others, focus on improving your own team’s consistency. This will help you make better forecasts and align expectations across all stakeholders.

2. Lead Time
Lead time measures the time taken from when a work item is created to when it’s completed. It’s a key indicator of your team's efficiency and highlights how quickly tasks are completed from start to finish.
When to Use:
Sprint Planning: Use lead time to understand how long tasks take to complete and to estimate future task durations.
Prioritization: Helps prioritize tasks by assessing how quickly your team can move on to the next task.
How to Track: Track lead time by measuring the time from task backlog to completion. Entelligence AI provides real-time insights, automatically tracking and reporting lead time to help optimize workflows.
Best Practices: Instead of solely focusing on reducing lead time, focus on improving consistency in lead time across tasks. Analyze trends over multiple sprints to adjust planning and improve overall team performance.
3. Cycle Time
Cycle time focuses on the time it takes for a task to be worked on, from the moment work begins until it is completed. It helps evaluate the efficiency of your team in moving tasks through the system once they start.
When to Use:
Task Efficiency: Use cycle time to assess how efficiently tasks are processed after the work starts.
Workflow Optimization: Identify slow points in the workflow to simplify and improve delivery speed.
How to Track: To track cycle time, measure the time from when work starts on a task until it is finished. Use tools like Kanban boards or cycle time reports in Jira to help visualize and monitor cycle time.
Best Practices: Regularly monitor cycle time and focus on removing bottlenecks or stages that slow down completion. Aim for consistency rather than constantly chasing shorter cycle times, as this can lead to burnout or quality issues.
4. Cumulative Flow Diagram (CFD)
A Cumulative Flow Diagram (CFD) visually tracks the flow of work through different stages of the process. It highlights work in progress, completed work, and potential bottlenecks, providing leadership with a clear picture of your team’s workload and performance.
When to Use:
Workflow Visibility: Use CFD to visualize how tasks move across the workflow stages (e.g., To Do, In Progress, Done).
Identifying Bottlenecks: Quickly identify if any stage is accumulating too much work, signaling a potential bottleneck.
How to Track: Generate a CFD using tools like Jira, Azure DevOps, or Entelligence AI. It will display the work in each stage over time, providing real-time insights into task flow and bottlenecks.
Best Practices: Focus on optimizing the flow by adjusting stages where work is piling up. Reallocate resources or adjust priorities to remove congestion. Ensure that the flow remains smooth and consistent, allowing for more efficient task completion.
5. Sprint Burndown
Sprint burndown charts track the amount of work remaining in a sprint, helping you gauge whether your team is on track to complete the sprint goal. It provides a clear visual of how much work is left and whether you are meeting your expected progress.
When to Use:
Sprint Monitoring: Use the sprint burndown to track progress and ensure the sprint is on track to meet its goal.
Mid-Sprint Adjustments: If the burndown is not following the expected trajectory, it helps identify potential delays or scope changes early on.
How to Track: To track sprint burndown, measure the remaining story points or tasks and update the chart daily. Tools like Jira or Targetprocess automatically generate and track this data.
Best Practices: Focus on realistic sprint planning to avoid drastic changes in scope during the sprint. Use the burndown chart to keep your team focused on completing committed tasks and adjusting workload if necessary.
Also Read: Sprint Velocity in Scrum: How to Measure and Calculate It Right?
6. Release Burndown
Release burndown tracks the progress of work against the release milestones, giving insight into whether the release schedule aligns with your team’s pace. It helps visualize how much work remains in the entire release cycle.
When to Use:
Release Planning: Use release burndown to track the overall progress of a release and ensure you are on target for timely delivery.
Tracking Scope Changes: It also helps identify scope creep during a release cycle, so leadership can make informed decisions on how to adjust resources.
How to Track: Track the amount of work remaining (in story points, tasks, etc.) against the overall release plan. Tools like Jira allow you to update release milestones and monitor progress throughout the release.
Best Practices: Regularly review the release burndown to spot early signs of delays. If the chart shows an increasing trend or stagnation, reallocate resources or adjust timelines to keep the release on track.
7. Escaped Defects
Escaped defects measure how many defects make it into production after a release, providing insights into your team’s quality assurance process. It’s important for understanding how well the team is preventing defects from reaching end-users.
When to Use:
Post-Release Quality: Track escaped defects after a release to evaluate the quality of work delivered to production.
Continuous Improvement: Helps identify weaknesses in the testing phase and improve product quality in future cycles.
How to Track: Track defects reported after production using bug tracking tools like Jira or Bugzilla. Compare the number of defects in production to pre-production testing results.
Best Practices: Focus on improving unit tests and automated testing earlier in your development process. If defect rates are high, consider adjusting your testing strategies and investing in better quality assurance tools.
8. Throughput
Throughput measures the amount of work your team completes over a given period. It’s a straightforward metric to track and offers an overview of your team’s capacity and efficiency.
When to Use:
Capacity Planning: Use throughput to understand how much work your team can handle in future sprints or releases.
Team Performance Evaluation: Throughput helps gauge overall developer productivity over time.
How to Track: Track the number of tasks, stories, or work items completed during a sprint or time period. Tools like Jira can automate the collection of throughput data and give you a historical view.
Best Practices: To improve throughput, focus on removing bottlenecks in the process. Ensure the team isn’t overloaded with work, and optimize workflow to maintain consistent throughput over time.
9. Work in Progress (WIP) Limits
WIP limits ensure that your team doesn’t take on more work than it can handle at any one time. This helps in maintaining focus and reducing bottlenecks. It’s a core principle of Kanban and helps keep the workflow manageable.
When to Use:
Flow Management: Use WIP limits to prevent your team from becoming overwhelmed by excessive tasks.
Task Focus: Helps ensure that the team is focused on completing work before starting new tasks.
How to Track: Set WIP limits for each stage of your workflow and track them using Kanban boards or project management tools like Trello or Jira. Tools will alert you when the limits are reached.
Best Practices: Set realistic WIP limits based on your team’s capacity and the type of work being done. Regularly review WIP limits to ensure they are helping your team focus without overloading them.
While the essential metrics provide foundational insights into team efficiency and sprint progress, advanced agile metrics can further enhance your leadership approach. These advanced metrics offer a more comprehensive understanding of long-term team performance and strategic value.
Also Read: How Entelligence AI Empowers Engineering Leaders to Drive High-Performing Teams
Advanced Agile Metrics for Leadership Success
If you’re looking to take your agile leadership to the next level, consider tracking these advanced metrics that provide deeper insights into your team’s effectiveness and long-term business value.
1. Defect Removal Efficiency (DRE)
DRE measures how effective your team is at identifying and removing defects before they reach production. It’s a quality metric that shows how well your team is preventing costly issues down the road and ensures that you’re delivering high-quality work to your customers.
When to Use:
Post-Release Quality Assessment: Use DRE to assess the quality of your team’s work post-release and to determine if defects were properly addressed before production.
Continuous Improvement: Track DRE to monitor how much your testing efforts are reducing post-production defects and improve processes over time.
How to Track: To track DRE, measure the defects that are identified pre-production through quality testing tools. Monitor the percentage of defects that are caught before they go live using tools like Jira or Bugzilla.
Improvement Path: To improve DRE, focus on strengthening unit testing and automation in your development pipeline. Regularly review test coverage and ensure your tests are comprehensive, which will reduce the number of defects that escape into production.
2. Employee Satisfaction and Team Happiness
Happy and engaged teams are more productive, creative, and aligned with business goals. When your team feels valued and satisfied, they are more likely to contribute innovative ideas and perform at their best.
When to Use:
Team Engagement: Track this metric regularly to gauge how engaged your team is with their work and company culture.
Wellness Monitoring: Use it to identify early signs of burnout, dissatisfaction, or misalignment within your team.
How to Track: To track team happiness, use tools like Officevibe, 15Five, or conduct regular employee satisfaction surveys to gauge team sentiment. You can also gather informal feedback during one-on-one meetings or retrospectives.
Leadership Actions: Use satisfaction data to improve team culture, ensure open communication, and reduce burnout. Take proactive steps to address concerns, improve the work environment, and invest in employee growth and well-being to keep your team motivated and engaged.
3. Customer Satisfaction (CSAT)
Customer Satisfaction (CSAT) is a measure of how well your team’s output aligns with customer needs and expectations. A direct link exists between team performance and customer satisfaction, and tracking CSAT ensures you’re consistently delivering what your customers value.
When to Use:
Post-Release Feedback: Track CSAT to see how well your team’s recent work meets the customer’s needs and identify areas where you can improve.
Customer Retention: Use CSAT to measure how your team’s work impacts customer loyalty and satisfaction in the long term.
How to Track: Track CSAT through post-release customer feedback surveys using tools like Survicate, Typeform, or Qualtrics. Typically, this involves a simple question like: “How satisfied are you with the product?” followed by a rating scale (e.g., 1-5).
Leadership Actions: Utilize CSAT data to align product delivery with customer expectations, identify areas for improvement, and ensure ongoing value creation. If satisfaction dips, engage with customers to understand their concerns and work closely with your team to make necessary improvements.
Advanced metrics provide valuable insights into your team’s performance and customer satisfaction, but knowing how to use them effectively is key to driving continuous improvement.

How to Use Agile Metrics for Leadership Optimization?
Agile metrics give you a clear view of how your team is performing and where things can be improved. By tracking key metrics like velocity and cycle time, you can quickly spot bottlenecks and areas for improvement. This data allows you to:
Make smarter decisions
Adjust priorities
Ensure that your team stays on track to meet their goals.
To get the most out of these metrics, use them to drive action. Don’t just track the numbers, discuss them with your team and use them to make real-time adjustments. This approach helps you stay aligned with your team’s strengths and weaknesses, ensuring you can lead them to consistent and measurable success.
While agile metrics offer valuable insights, using them incorrectly can lead to unintended consequences. To ensure you're maximizing their potential, it’s important to recognize the pitfalls that can derail your efforts.
Also Read: Windsurf SWE 1.5 and Cursor Composer-1: Two new coding models you should be aware of
Common Pitfalls to Avoid When Using Agile Metrics
Agile metrics are valuable tools, but misinterpreting or over-relying on them can lead to poor decisions. Here are some key pitfalls to avoid:
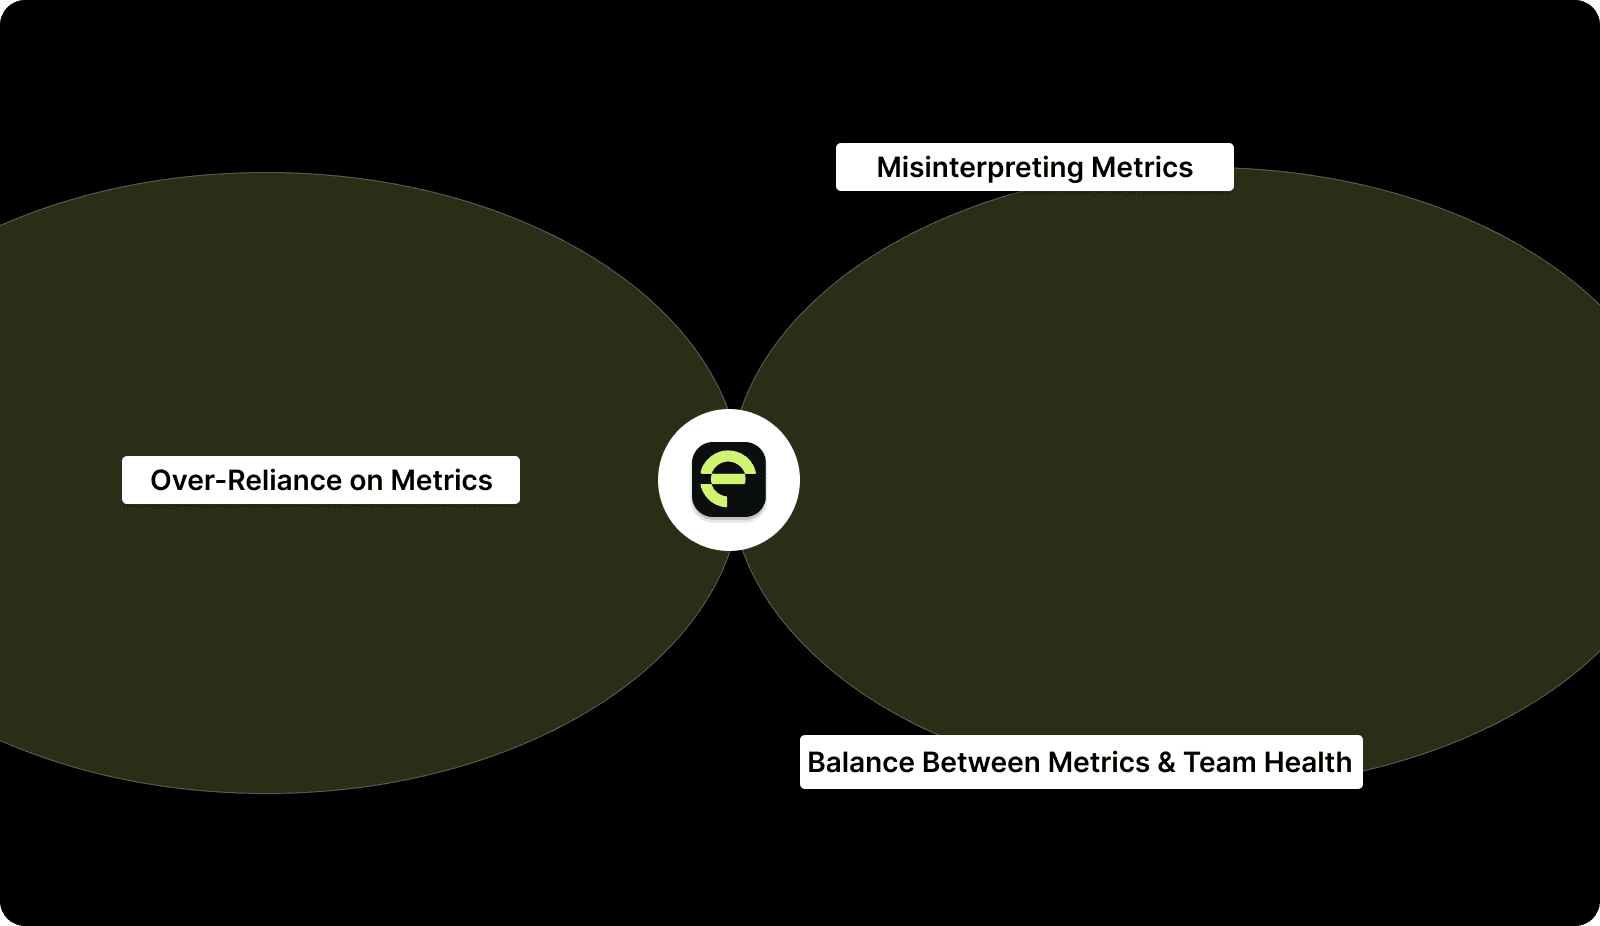
1. Over-Reliance on Metrics
Focusing too much on numbers can cloud judgment. Always consider the full context: metrics are a guide, not the entire story. Don’t let data dictate decisions without understanding the team’s challenges.
2. Misinterpreting Metrics
Rushing to conclusions based on one data point can mislead you. Look at trends over time and cross-reference with qualitative insights to gain accurate, actionable knowledge.
3. Balance Between Metrics and Team Health
Metrics matter, but don’t forget the people behind them. Agile success relies on collaboration, communication, and motivation. Ensure metrics don’t undermine team morale or personal well-being.
In conclusion, using agile metrics the right way allows you to lead with clarity and precision. Entelligence AI provides you with real-time insights to make better decisions and optimize your team’s performance.
How Entelligence AI Can Help Optimize Leadership with Agile Metrics?
In agile leadership, tracking and interpreting metrics is important for making informed decisions, but manual processes often lead to errors and delays. The challenge is turning data into actionable insights that drive your team's performance and align with strategic goals.
Entelligence AI solves this by offering an integrated platform that tracks key metrics and provides real-time insights into code quality, security, and engineering velocity. Unlike traditional tools, Entelligence AI is an overall optimal solution for engineering organizations, encouraging leadership with clear, actionable data.
Key Features of Entelligence AI:
Real-Time Metrics Dashboard: Monitor velocity, cycle time, burndown charts, and more in real time, giving you a comprehensive view of your team’s progress.
Actionable Insights: Go beyond the numbers with deep data analysis that helps identify bottlenecks, resource gaps, and team performance trends.
Code Quality Assurance: Track defect removal efficiency (DRE), escapes defects, and automated testing to ensure high-quality code with minimal risk to production.
Security Integration: Continuous security checks within your CI/CD pipeline to keep your team’s work secure and free of vulnerabilities.
Team Performance Analytics: Measure employee satisfaction, collaboration, and overall team health with advanced metrics that balance both output and well-being.
Agile Workflow Optimization: Use cumulative flow diagrams (CFD), WIP limits, and throughput analysis to simplify workflows and ensure continuous delivery at scale.
With Entelligence AI, you gain not just data but the strategic clarity needed to drive team success, improve agility, and achieve better outcomes for your engineering teams.

Conclusion
Agile metrics are essential for leadership to make informed decisions and improve team performance. By tracking key metrics like velocity, cycle time, and lead time, you can remove bottlenecks, optimize workflows, and align your team with business goals. These metrics encourage you to drive continuous improvement and make smarter decisions.
Entelligence AI offers an integrated platform that provides real-time insights into code quality, security, and engineering velocity. With Entelligence AI, you can not only track agile metrics but also act on them instantly, optimizing team performance and driving continuous improvement.
Do you want to enhance your leadership with agile metrics? Book a demo of Entelligence AI today to access real-time data, simplify your team’s performance, and drive impactful decisions that accelerate success.
FAQs
Q. What are the 4 pillars of Agile?
The four pillars of Agile are Individuals and interactions over processes and tools, Working software over comprehensive documentation, Customer collaboration over contract negotiation, and Responding to change over following a plan.
Q. What is the best way to implement velocity tracking in my team?
Start by measuring the story points completed in each sprint. Track velocity over several sprints to identify trends. Ensure consistency, avoid comparing teams, and use data to forecast future capacity and improve sprint planning.
Q. How can leadership use agile metrics to reduce bottlenecks and improve team performance?
Leadership can identify bottlenecks by tracking metrics like cycle time, WIP limits, and throughput. Analyzing these metrics helps pinpoint where work is getting delayed, allowing leadership to allocate resources and adjust workflows to improve efficiency.
Q. What are good metrics to use to measure the performance of a team using Agile software development methodology?
Key metrics include velocity, cycle time, lead time, burndown charts, and throughput. These metrics provide insights into team efficiency, capacity, progress, and bottlenecks, helping leadership make informed decisions and optimize performance.