Code Quality Dashboard: Track and Improve Team Performance
Did you know that resolving defects after release costs 4 to 5 times more than fixing the same issues during the design and development phase? Every bug that slips through costs your team more time and effort compared to catching it before merge, turning what could be quick fixes into lengthy production incidents.
Engineering teams need visibility into quality trends to prevent this expensive cycle. Code quality dashboards provide real-time insights into test coverage, bug patterns, and security vulnerabilities, helping you catch issues when fixes take minutes instead of days. The earlier you spot problems, the less they cost to resolve.
In this guide, we cover in detail what code quality dashboards track, which metrics matter most, and how to implement monitoring that keeps your quality high and your costs low.
Key Takeaways
Code quality dashboards provide real-time visibility into metrics like coverage, bugs, complexity, and security vulnerabilities across your codebase.
Teams that track quality metrics catch defects much earlier in the development cycle, reducing production incidents and emergency patches.
The most effective dashboards focus on 5-7 core metrics rather than tracking everything, keeping teams focused on what drives quality.
Automated quality tracking removes the need for manual metric collection, saving engineering leaders several hours per week on status reporting.
Quality dashboards help communicate technical health to non-technical stakeholders using clear visualizations and trend data.
What is a Code Quality Dashboard?
A code quality dashboard is a centralized interface that displays real-time metrics about your codebase's health. It aggregates data from static analysis tools, test runners, security scanners, and version control systems into visual reports that show quality trends over time.
For example, when your team opens a pull request, the dashboard updates automatically with new coverage percentages, detected issues, and review quality scores. Engineering leaders can see which repositories need attention, which developers need support, and whether quality is improving or declining sprint over sprint.
Why Do Engineering Teams Need Code Quality Dashboards?
Quality dashboards change how teams understand and improve their code. Without them, quality management relies on gut feelings and reactive firefighting instead of data-driven decisions. Here's why code quality dashboards matter:
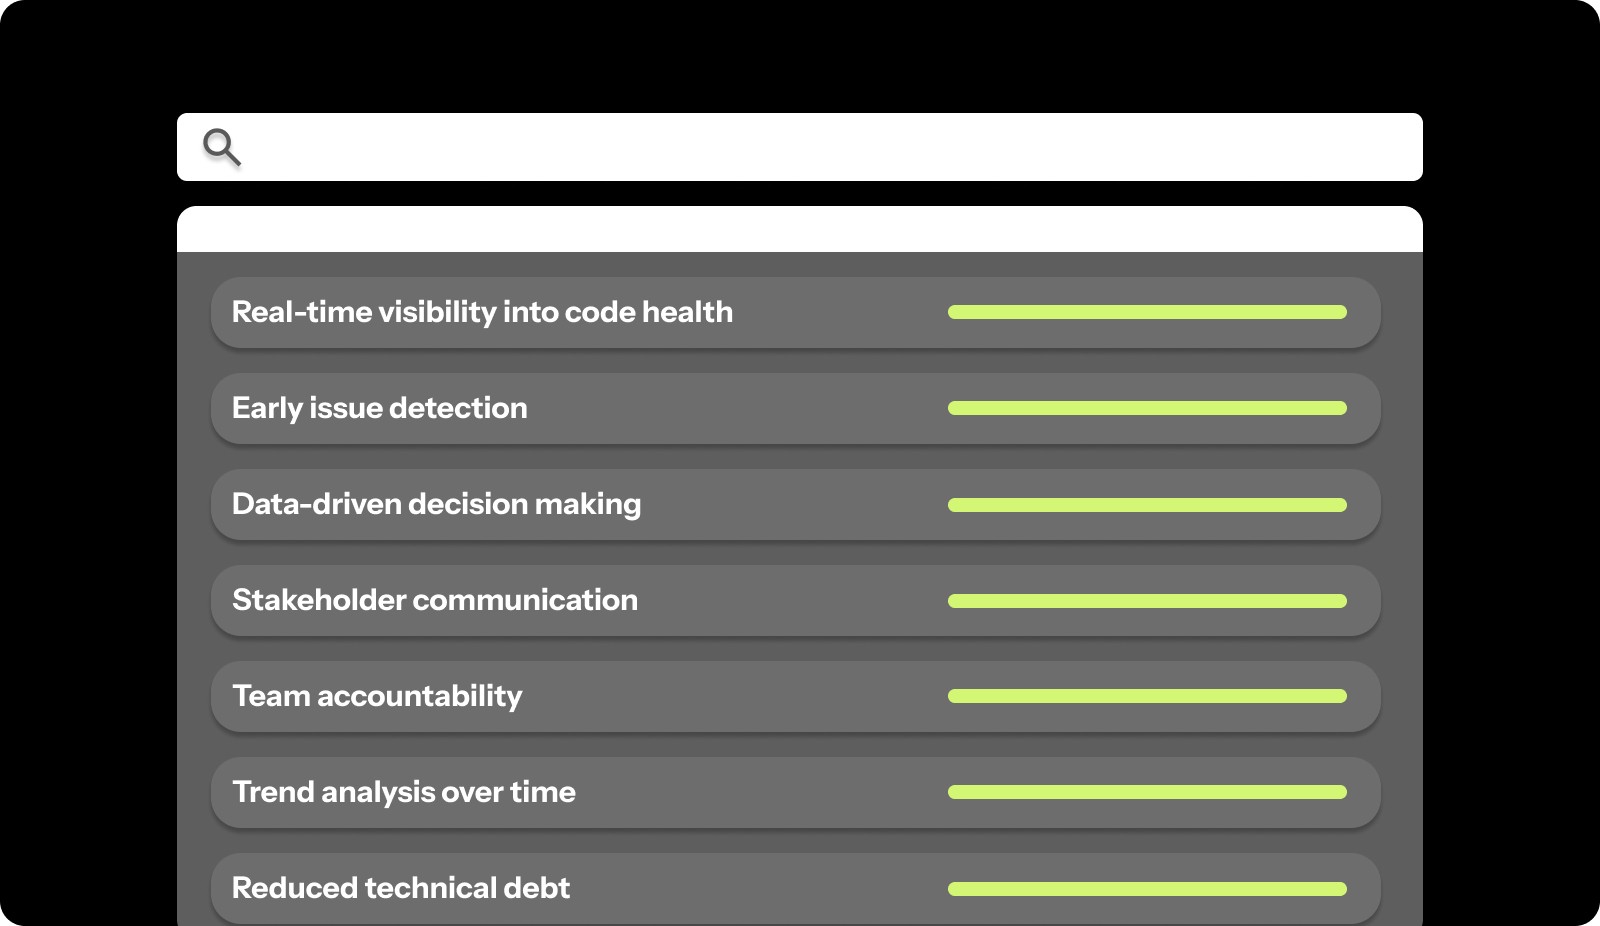
Real-time visibility into code health: Dashboards show current quality status across all repositories, letting you spot degrading patterns before they cause production incidents instead of discovering problems through customer complaints.
Early issue detection: Automated quality tracking catches bugs, security vulnerabilities, and architectural problems during development, when fixes take minutes instead of hours or days after deployment.
Data-driven decision making: Hard metrics on coverage, defect rates, and review quality help you prioritize refactoring work, allocate engineering time, and justify quality investments to leadership with clear ROI data.
Stakeholder communication: Visual dashboards translate technical quality concepts into charts and trends that product managers, executives, and investors can understand without deep technical knowledge.
Team accountability: Public quality metrics create healthy ownership, encouraging engineers to maintain standards and take pride in clean, well-tested code rather than rushing features without proper quality checks.
Trend analysis over time: Historical data shows whether quality initiatives are working, sprint retrospectives have concrete evidence to discuss, and teams can celebrate measurable improvements in their practices.
Reduced technical debt: Tracking debt metrics helps teams see accumulation patterns and schedule regular cleanup work before codebases become unmaintainable and slow down feature development.
Faster PR reviews: Quality gates in dashboards automate first-pass checks on test coverage, style violations, and basic bugs, letting human reviewers focus on logic and architecture instead of catching syntax errors during code reviews.
These benefits compound over time. Teams that implement quality dashboards experience faster feature delivery, fewer production incidents, and improved developer satisfaction as quality work becomes visible and valued.
What Metrics Should a Code Quality Dashboard Track?
Effective dashboards focus on metrics that drive action. Tracking everything creates chaos, while tracking the right things guides improvement and prevents problems before they escalate. Here's how different metric categories compare:
Metric Category | What It Measures | Why It Matters |
Code Coverage | Percentage of code exercised by tests | Shows gaps in test protection |
Bug Density | Defects per thousand lines of code | Indicates overall code stability |
Code Complexity | Cyclomatic complexity, function length | Flags maintainability problems |
Review Quality | Review depth, comment acceptance | Measures the effectiveness of code reviews |
Security Vulnerabilities | Known CVEs, secret leaks, unsafe patterns | Prevents production security incidents |
Technical Debt | Code smells, duplication, and outdated dependencies | Tracks long-term codebase health |
Your dashboard should include metrics from each category for complete visibility:
1. Code Coverage Metrics
Code coverage metrics show the percentage of your codebase that has automated test protection. Higher coverage means fewer untested code paths that can break without warning.
For instance, if your checkout flow has 45% coverage while other features average 80%, you know where to focus testing efforts. Code coverage alone doesn't guarantee quality, but uncovered code definitely carries more risk.
2. Bug and Defect Metrics
Bug metrics measure defect density, open bug counts, and time to resolution across your codebase. These numbers show whether quality is improving or declining and help you catch patterns before they escalate into production incidents.
Track bugs by severity, bugs found in development versus production, and bug creation versus resolution rates. For example, if you're creating bugs faster than closing them, quality is actively degrading and needs immediate attention.
3. Code Complexity Metrics
Complexity metrics flag functions that are difficult to understand, test, and maintain. High cyclomatic complexity, long functions, and deep nesting all increase the chance of bugs and make future changes risky.
Your dashboard should highlight the most complex areas of your codebase. For instance, a function with cyclomatic complexity over 15 probably needs refactoring into smaller, testable pieces before someone tries to modify it and introduces bugs.
4. Review Quality Metrics
Review metrics show how thoroughly your team examines code before merge. Track PR review time, comment count per PR, and percentage of PRs merged with meaningful feedback versus rubber-stamped approvals.
For example, if 60% of PRs merge with zero comments, reviews aren't catching issues. Quality dashboards can flag this pattern so managers can coach reviewers or adjust workloads to allow proper review time.
5. Security Vulnerability Metrics
Security metrics track known vulnerabilities, secret leaks, and unsafe code patterns across your repositories. Automated security scanning catches problems like SQL injection risks, hardcoded credentials, and outdated dependencies with known exploits.
Your dashboard should show open vulnerabilities by severity, time to remediation, and trends in new versus fixed security issues. For instance, if critical vulnerabilities sit open for weeks, security isn't getting proper priority in your sprint planning.
6. Technical Debt Metrics
Debt metrics measure code smells, duplication, and maintainability issues that slow down development over time. While not urgent like security vulnerabilities, accumulated technical debt makes every feature harder to build and increases bug rates.
Track debt ratio, most problematic files, and debt trends over time. For example, if debt is growing faster than you're paying it down, future development will become progressively slower and more expensive.
How to Set Up an Effective Code Quality Dashboard?
Setting up quality tracking requires choosing the right metrics, configuring automation, and creating views that drive action instead of just displaying numbers. Here's how to build dashboards that improve code quality:
1. Define Your Quality Goals
Start by identifying what quality means for your team and organization. Different contexts require different priorities. A healthcare platform might prioritize security and correctness, while a consumer app might focus on performance and user experience bugs.
Work with your team to define specific engineering objectives. For instance, "Maintain 80% test coverage on critical business logic" or "Resolve all high-severity security vulnerabilities within 48 hours" gives clear targets to track.
2. Choose the Right Metrics
Select 5-7 core metrics that align with your quality goals. Tracking too many metrics creates dashboard fatigue, where no one pays attention. Tracking too few misses important quality dimensions.
Balance leading indicators that predict problems with lagging indicators that measure outcomes. For example, review thoroughness is a leading indicator of bug rates, while production incident counts are a lagging indicator of overall quality.
3. Select Your Tools and Integrations
Connect your dashboard to existing development tools. Pull coverage data from test runners, static analysis results from linters, security findings from scanners, and PR data from version control systems.
For instance, integrate with GitHub for PR metrics, SonarQube for technical debt, Snyk for security vulnerabilities, and your CI/CD system for test results. Unified dashboards remove tool-switching and give complete context in one view.
4. Set Baseline Measurements
Measure current quality levels before implementing improvement initiatives. Baselines let you track progress objectively and show stakeholders that quality investments are working.
For example, if your baseline shows 62% test coverage and 850 open technical debt issues, you can measure improvement three months later when coverage reaches 78% and debt drops to 620 issues.
5. Configure Automated Tracking
Automation removes manual reporting overhead and keeps dashboards current. Set up integrations that update quality metrics on every commit, pull request, and merge without requiring engineers to log data manually.
For instance, configure post-merge hooks that recalculate coverage, run static analysis, and update dashboard displays automatically. Engineers see fresh data without spending time generating reports.
6. Create Custom Views for Different Stakeholders
Build different dashboard views for engineers, managers, and executives. Developers need detailed file-level metrics and specific issues to fix. Managers need team-level trends and bottleneck identification. Executives need high-level health scores and comparisons to goals.
For example, an engineering view might show which files need refactoring, while an executive view shows overall quality score trends and comparison to industry benchmarks.
Common Mistakes When Using Code Quality Dashboards
Even well-designed dashboards can fail to improve code quality if teams track the wrong metrics or use data incorrectly. Knowing common pitfalls helps you avoid them from the start.
Watch out for these common mistakes:
Tracking too many metrics: Dashboards with 20+ metrics overwhelm teams and dilute focus, making it impossible to know which numbers actually matter or where to invest improvement effort.
Ignoring context behind numbers: A drop in coverage might mean you deleted unused code rather than skipped tests, but dashboards without context can trigger false alarms and wasted investigation time.
Setting unrealistic benchmarks: Demanding 100% coverage or zero technical debt creates impossible standards that encourage teams to game metrics by writing meaningless tests or hiding debt in ways tools can't detect.
Using metrics to punish developers: Tying quality metrics to performance reviews creates fear that makes engineers hide problems, inflate numbers, and resist necessary refactoring work that temporarily lowers scores and developer productivity.
Not acting on dashboard insights: Dashboards that no one reviews or acts on waste tool investment and signal to teams that quality doesn't actually matter, despite leadership claims otherwise.
Overlooking trends for point-in-time data: One week's coverage dip might not matter, but three months of declining coverage show a systemic problem that needs immediate attention and process changes.
How to Get Team Buy-In for Quality Dashboards?
Engineers resist quality tracking when it feels like surveillance rather than support. Getting buy-in requires showing how dashboards help developers ship better code faster, not just giving managers reasons for criticism.
Here's how to build support:
Involve the team in metric selection: Let engineers help choose which metrics to track, giving them ownership over quality standards rather than feeling like metrics were imposed from above without their input.
Show benefits to individual developers: Demonstrate how dashboards help engineers find their own bugs early, identify fragile code before it breaks, and prove the value of their cleanup work to leadership.
Start with visibility, not enforcement: Roll out dashboards as information tools before adding quality gates that block merges, letting teams get comfortable with metrics before consequences attach.
Celebrate improvements publicly: When coverage increases, or debt decreases, recognize team efforts in standups and retrospectives, making quality work visible instead of thankless background maintenance.
Use metrics to guide support, not blame: When quality drops, managers should ask "what's blocking you" instead of "why did this happen," positioning dashboards as diagnostic tools that surface problems needing organizational support.
When teams see dashboards as tools that make their work easier and more visible, adoption happens naturally. Engineers who initially resisted tracking often become the strongest advocates once they experience how quality metrics help them write better code and get recognition for improvement work.
Track Code Quality and Team Performance with Entelligence AI
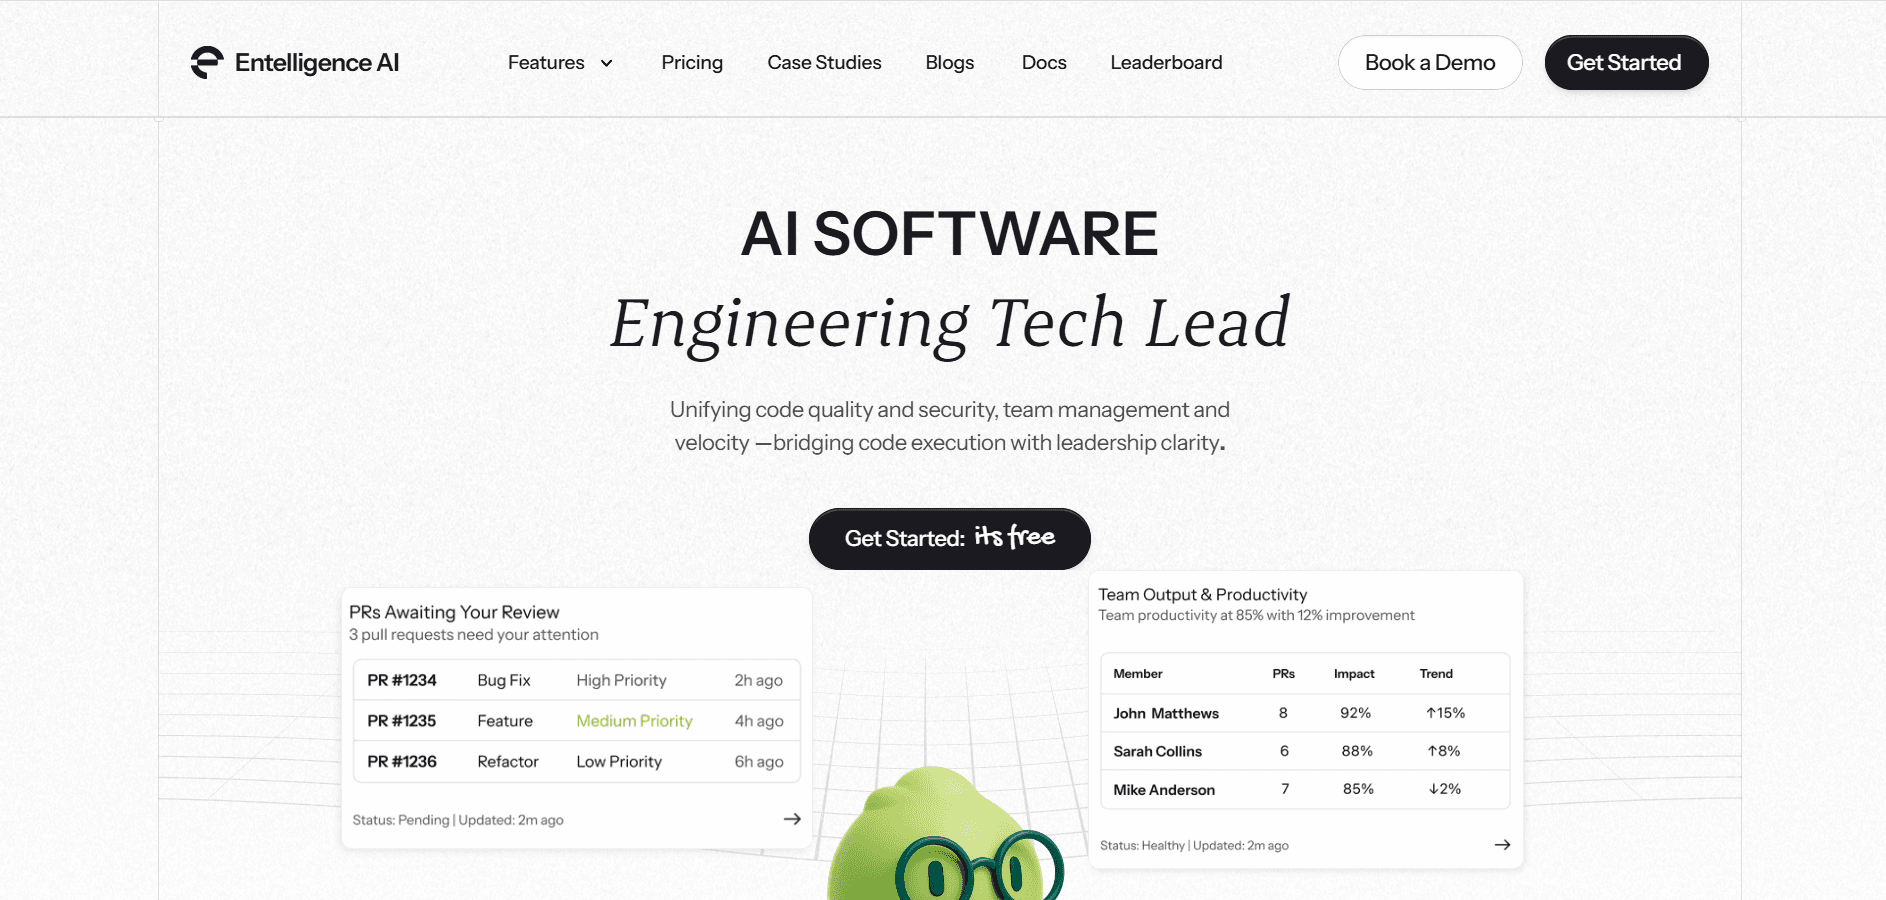
Your team needs quality visibility without adding manual tracking overhead. Most quality tools force you to jump between multiple dashboards, correlate data manually, and spend hours generating reports for stakeholders.
Entelligence AI unifies code quality, security scanning, and team performance into comprehensive dashboards that update automatically. You get real-time insights into what's improving, what needs attention, and where to invest engineering effort for maximum impact.
Here's how Entelligence AI helps engineering teams maintain quality at scale:
Comprehensive quality metrics: Track coverage, complexity, bugs, technical debt, and code smells across all repositories with automated analysis that runs on every pull request.
Automated security scanning: Real-time SAST scanning and vulnerability tracking catch security issues before merge with auto-generated remediation suggestions.
Team performance dashboards: See individual and team quality trends, review thoroughness, and contribution patterns with AI-driven insights that identify bottlenecks before they slow delivery.
Executive reporting: Generate compliance-ready PDF reports and email summaries with quality trends, risk assessments, and improvement recommendations formatted for non-technical stakeholders.
Quality gate enforcement: Block merges that fail coverage thresholds, introduce high-severity bugs, or contain security vulnerabilities, preventing quality degradation before it enters your codebase.
Composio used Entelligence AI to track code quality across their fast-moving development team. They saved 100+ hours monthly on manual reviews and caught critical issues before production.
Final Thoughts
Code quality dashboards change quality from an abstract goal into measurable outcomes you can track and improve. The right metrics show where your codebase is healthy, where it's deteriorating, and where to invest improvement effort for maximum impact.
The most effective approach is to begin with clear quality goals and 5-7 core metrics that drive action. Configure automated tracking so dashboards stay current without manual reporting overhead. Use insights to guide support rather than assign blame, building a culture where engineers take pride in quality work.
Entelligence AI gives engineering teams unified quality dashboards with automated insights, security scanning, and team performance tracking in one platform. Stop jumping between tools and start making data-driven quality decisions. Start your 14-day free trial and see your complete code quality picture in minutes.
FAQs
1. What is the difference between a code quality dashboard and a code review tool?
Code review tools analyze individual pull requests and suggest improvements, while code quality dashboards track overall codebase health trends over time. Dashboards aggregate data from reviews, tests, and static analysis to show quality patterns across your entire organization rather than focusing on single code changes.
2. How often should code quality metrics be reviewed?
Engineering managers should review quality dashboards weekly to catch degrading trends early, while teams should check metrics during sprint planning and retrospectives. Executive stakeholders typically review monthly or quarterly reports showing long-term quality trends and improvement against organizational goals.
3. Can quality dashboards work for legacy codebases?
Yes, but start by measuring the current state without judgment, then set realistic improvement targets. Track trend direction rather than absolute scores. For example, reducing technical debt by 10% quarterly shows progress even if overall debt remains high in a large legacy system.
4. What metrics should startups prioritize on their quality dashboards?
Early-stage startups should focus on security vulnerabilities, critical bugs, and test coverage for core business logic. As you scale, add technical debt tracking, review quality, and complexity metrics. Prioritize metrics that prevent customer-facing incidents over those that optimize long-term maintainability until you achieve product-market fit.
5. Should quality metrics be visible to the entire engineering team?
Yes, transparent quality metrics create shared ownership and accountability. Make dashboards accessible to all engineers so they can see their impact, understand team standards, and take pride in improvement efforts. Hide metrics only when they're being used inappropriately to create unhealthy competition or blame culture.