15 Software Engineering KPIs to Track in 2026
For a long time, software teams have faced a new reality: Shorter release cycles and growing pressure to deliver both speed and quality. In fact, only about half of tech managers say their companies even attempt to measure developer productivity, and just 16% have dedicated specialists for it. So, how do you ensure that your engineering team's productivity is measured?
This lack of visibility has a clear cost: Missed goals, inefficient processes, and developer frustration over being measured by the wrong metrics. The solution lies in tracking the right software engineering KPIs. Done well, this turns chaos into clarity.
The key, however, is not to track everything.
In this article, we'll discuss only a few important indicators that reveal how efficiently your teams build, review, and deliver software. These indicators will also assess the health of your team's infrastructure.
Highlights
Balancing speed and quality is a major challenge, as only 16% of tech managers have dedicated specialists to measure productivity.
Measuring the wrong KPIs can lead to inefficiency and missed deadlines.
True KPIs, like cycle time and change failure rate, focus on process health and efficiency, unlike misleading activity metrics like commit counts.
Activity metrics, such as lines of code and commit counts, often encourage quantity over quality, leading to poor code practices.
Deployment frequency indicates agility; frequent, smaller deployments improve responsiveness and reduce production issues.
What is a Good KPI for Engineering Teams?
A good software engineering KPI measures impact, not just activity. It turns engineering data into insight, showing how effectively teams build, ship, and maintain quality software.
Numbers like commit count or PR volume often mislead. True KPIs for developers, such as cycle time or change failure rate, reveal process health and delivery efficiency.
It balances three forces every engineering organization must manage: Speed, quality, and team health. Most importantly, good KPIs grow. As teams scale, metrics should adapt to reflect maturity, predictability, and sustainability.
While good KPIs can ensure steady progress, the cost of measuring the wrong KPIs is often underestimated. Poorly chosen metrics can lead your engineering team down the wrong path entirely.
Also Read: 10 Proven Strategies to Manage Your Software Development Team
What If You're Measuring the Wrong Success?
The key to success is in ensuring that the data you collect actually supports your team’s goals and drives meaningful outcomes. So, ineffective KPIs provide non-actionable insights.
That's why, when engineering KPIs focus on irrelevant metrics, you risk misaligning your team’s efforts and incurring higher costs.
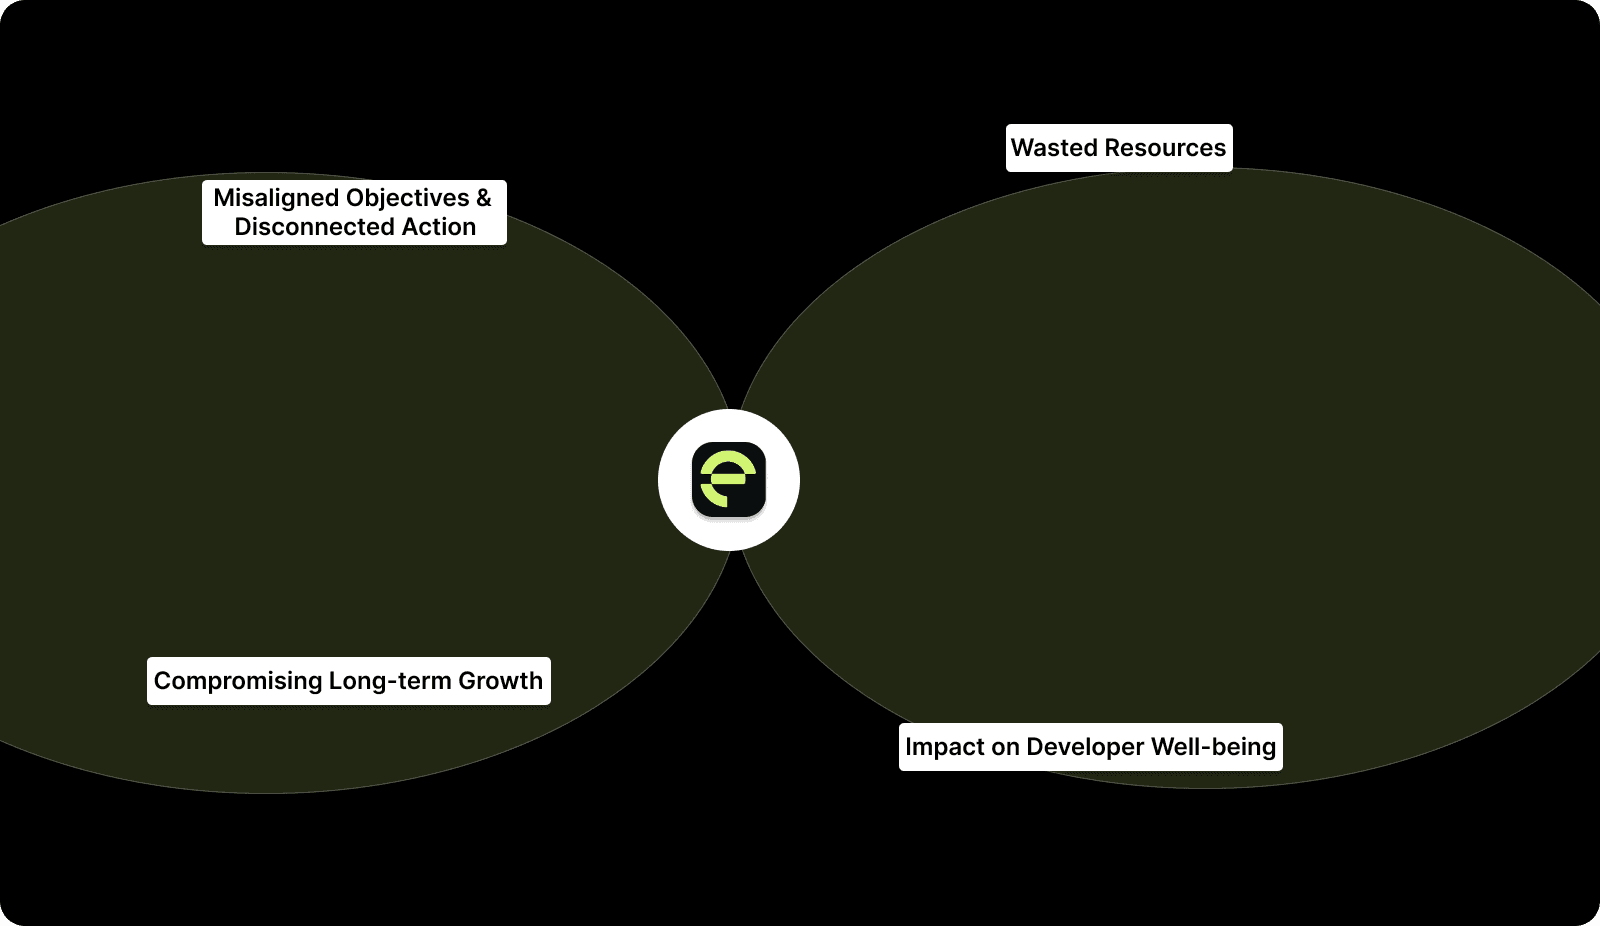
1. Misaligned Objectives and Disconnected Action
When teams measure the wrong things, they focus their energy in the wrong direction. For instance, tracking lines of code or the number of commits might sound productive, but these are activity metrics, not performance indicators.
They don’t provide insight into actual progress or quality. Teams may become obsessed with output numbers, leading to shortcuts, sloppy code, or burnout.
2. Wasted Resources
Wrong KPIs lead to inefficiency. For instance, tracking PR count might encourage faster merges, but it doesn’t measure code quality or peer engagement. In practice, this can lead to higher defect rates and increased bug-fixing cycles.
3. Impact on Developer Well-being
Focusing on the wrong KPIs also affects team morale. If developers feel measured by arbitrary metrics like lines of code written, they may prioritize speed over quality. This can lead to demotivation and a lack of pride in their work.
Moreover, high-pressure KPIs such as velocity can encourage developers to work overtime to meet targets, harming their well-being and increasing turnover.
4. Compromising Long-term Growth
Focusing on vanity metrics or the wrong KPIs compromises long-term growth. Short-term gains, like pushing for more commits or faster deployments, may mask deeper issues with codebase stability or team collaboration.
When leaders and developers chase the wrong numbers, the organization ultimately sacrifices the robustness needed for scale.
So, to avoid these pitfalls, engineering teams must focus on KPIs that align with their unique strategic goals.

With Entelligence AI's Team Management features, track key engineering KPIs like velocity, code quality, and sprint health in real time. Since it provides insights into PR turnaround, it helps managers to optimize KPIs such as change failure rate, deployment frequency, and team collaboration.
This enables proactive, data-driven decision-making to enhance overall productivity and software delivery.
With a clear understanding of the high cost of measuring the wrong ones, let's understand the key software engineering KPIs every team should track in 2026.
Read Also: Ultimate Guide to Static Code Analysis Tools in 2025
15 Key KPIs for Developers for Your Engineering Team
With so many metrics out there, how do you know which ones truly matter? The answer lies in a combination of both leading and lagging indicators. Only leading KPIs provide real-time insights into your team’s efficiency.
To help you focus on what truly drives engineering productivity, quality, and team health, here’s a quick overview of the 15 KPIs:
KPI | Description | Why It Matters |
|---|---|---|
Cycle Time | Time from code commit to production deployment. | Measures efficiency and highlights process challenges. |
Lead Time for Changes | Time from ticket creation to code deployment. | Reflects how quickly features and fixes reach production. |
Deployment Frequency | Number of deployments per week/month. | Indicates team agility and CI/CD pipeline efficiency. |
Change Failure Rate (CFR) | Percentage of deployments causing failure or requiring rollback. | Measures the stability and reliability of releases. |
Mean Time to Recovery (MTTR) | Average time to recover from failures. | Reflects team resilience and the ability to recover from incidents quickly. |
Pull Request (PR) Metrics | Includes PR review time, merge time, and PR size. | Tracks team collaboration and review challenges. |
Code Quality | Metrics like code coverage, defect density, and maintainability. | Ensures the codebase is strong, scalable, and maintainable. |
Bug Rate | Number of bugs reported per release. | Reflects the quality of code shipped and user experience. |
Defect Resolution Time | Time taken to fix reported defects. | Measures how efficiently the team handles and fixes issues. |
Developer Productivity | Output per developer (e.g., commits, code reviews). | Helps evaluate individual performance and efficiency. |
Sprint Predictability | The percentage of sprint goals achieved as planned. | Reflects how well teams estimate and deliver against plans. |
Work-in-Progress (WIP) | Number of tasks currently being worked on by the team. | Helps assess team focus and capacity. |
Team Collaboration | Measured by communication frequency, PR comments, and team activity. | Shows how well the team is working together. |
Time-to-Merge | Time between PR submission and merging. | Measures how fast code moves from review to production. |
Security Vulnerabilities | Number of security flaws detected per release. | Ensures the software is secure, reducing future vulnerabilities. |
1. Cycle Time
It starts when code work begins (first commit or task start) and ends when that change is deployed to production. Shorter cycle times mean faster feedback, quicker delivery, and rapid iteration.
How to measure:
Timestamp when the developer starts working (commit or branch creation).
Timestamp when the change hits production.
Subtract start from end → per task / PR.
Aggregated averages over time (sprint, month) provide the team's baseline.
What to watch out for: Differences in task complexity; comparing across teams without context leads to misleading conclusions.
How to improve: Break work into smaller tasks, enforce small, frequent PRs, and improve CI/CD pipelines.
2. Lead Time for Changes
This is the time from when a ticket/feature request is created (or demand raised) to when it lands in production. It includes waiting in backlog, planning, coding, review, and deployment.
How to measure:
Record ticket creation time.
Record production deployment time for code addressing that ticket.
Delta = lead time. Use the average or distribution over time.
Watch out: Ticket scope changes mid-way; features delayed for non-development reasons (dependency on external teams, approvals) distort the metric.
Improve via: Prioritization discipline, breaking down features, reducing backlog wait times, and organizing dependencies.
3. Deployment Frequency
It implies how often code gets deployed to production (e.g., daily, weekly, multiple times per week). Indicates maturity of CI/CD; frequent small deployments reduce risk and accelerate value delivery.
How to measure:
Count deployments in a given interval and normalize (per team/service).
Watch out: High frequency + poor quality → high failure rates. Also, meaningless if many deployments are trivial or revert quickly.
Improve via: Automate testing and deployment; encourage small batch releases; feature toggles; incremental rollout.
4. Change Failure Rate (CFR)
Percentage of deployments that resulted in issues, such as failures, rollbacks, and production bugs. Reflects reliability and release safety; a stable release process is essential for user trust and team confidence.
How to measure:
(Number of failed deployments ÷ total deployments) × 100 for a period.
Watch out: Need a consistent definition of “failure.” Infrastructure issues vs code issues should be categorized.
Improve via: Better automated testing, code reviews, staging environments, gradual rollout, and rollback strategy.
5. Mean Time to Recovery (MTTR)
This is the average time it takes to restore service after a failure/outage.
How to measure:
Time from incident detection to resolution. Average across incidents in the timeframe.
Watch out: If incidents aren’t reported or tracked properly, data will under-report real issues.
Improve via: Incident response plans, alerts and monitoring, runbooks, post-mortems, and continuous improvement.
6. Pull Request / Merge Metrics (PR Metrics)
Metrics around PR workflow, time-to-first-review, time-to-merge, PR size, merge frequency per engineer, etc. Many of these tie to cycle time or throughput. PR workflows often challenge delivery.
How to measure:
PR submitted → track time until first review comment.
Time from submission to merge.
PR size (lines changed).
Merge frequency per engineer/week.
Improve via: Encourage smaller PRs, automate checks, distribute review load evenly, and use tools to highlight stale PRs.
Entelligence AI-powered Contextual Code Reviews, which provide real-time analysis of both committed and uncommitted changes within the IDE. This feature provides suggestions aligned with coding standards and dependencies, including potential bugs and missing tests.
This reduces the back-and-forth with reviewers and ensures higher-quality, bug-free code before teammates see the changes.
7. Code Quality Metrics
These are static metrics: Test coverage, cyclomatic complexity/maintainability, readability, duplication, security warnings, complexity, etc. Even fast delivery is worthless if code becomes unmaintainable, buggy, or unstable. High-quality codebases reduce defects and long-term costs.
For example, a study of 39 production codebases found that low-quality code had ~15× more defects and took ~124% more time to resolve issues.
How to measure:
Use static analysis tools, code‑coverage tools, and linters; track metrics over time (per commit/PR/sprint).
Watch out: Relying only on superficial metrics (e.g., coverage %) without understanding what coverage means; high coverage doesn’t guarantee quality.
Improve via: Automated testing, code-review standards, refactoring, pair programming, and continuous code quality checks.
8. Bug / Defect Rate
Number of bugs or defects introduced per release or per unit of work (e.g., per 1,000 lines or per feature). It’s a direct signal of quality from the user's standpoint; fewer bugs mean a better user experience and lower maintenance costs.
How to measure:
Track bug reports, incidents, or issues opened post-deployment; normalize by release count or lines-of-code changed.
Watch out: Not all bugs are equal. Severity matters. Also, measurement depends on a strong bug-tracking discipline (logging all issues, including minor ones).
Improve via: Strong QA pipelines, automated tests, code reviews, incremental deployments, monitoring & feedback loops.
9. Defect Resolution Time
Time from when a defect is logged to when it’s resolved and deployed. Long resolution times erode user trust and accumulate backlog.
How to measure:
Track issue creation and resolution timestamps, then compute average resolution time over a period.
Watch out: The Complexity of bugs, priority variation, and external dependencies can distort averages.
Improve via: Prioritization discipline, efficient issue triage, automated testing, and easy rollback/fix flows.
10. Throughput / Delivery Output
Quantity of completed work (features, tickets, story‑points, tasks) over a time period. This helps plan capacity, predict delivery timelines, and measure team-level productivity.
How to measure:
Count completed tickets or story points per sprint or per month. Normalize by team size.
Watch out: Can incentivize quantity over quality; unfortunate if story-point estimation is inconsistent.
Improve via: Combine throughput with quality metrics; encourage realistic estimates; maintain code quality.
11. Work‑in‑Progress (WIP) & Flow Efficiency
Number of concurrent tasks in progress; ratio of active work time vs idle/wait time vs total cycle time. Flow efficiency signals how smoothly work flows through the pipeline, and how much is waiting/blocked.
How to measure:
Track tasks in progress, track timelines, and calculate ratios. Use cumulative flow diagrams to visualize backlog, in progress, review, and done.
Watch out: Different kinds of work mix (bugs vs features) can distort rates; need consistent task types and categorization.
Improve via: Limit WIP, enforce review or merge gates, avoid multitasking, and encourage completion before starting new tasks.
12. Team Health & Collaboration Metrics
Metrics that reflect code review participation, reviewer load balance, inter‑team collaboration, distribution of work, etc.
Teams with a balanced review load and a collaborative culture tend to have fewer defects and greater stability.
How to measure:
Use review data (comments, time-to-review, number of reviewers), distribution of assignments, track review delays, and use pulse surveys for developer sentiment.
Watch out: Metrics can be gamed (e.g., superficial reviews to increase counts). Quantitative data must be interpreted with qualitative feedback.
Improve via: Distribute review assignments, encourage peer reviews, audits of review quality, rotate review duties, and track both speed and quality.
13. Sprint Predictability / Plan Accuracy
How much of the planned sprint work actually gets delivered, e.g., “planned vs completed story points,” % of sprint goals met.
How to measure:
Compare sprint plan (tickets / story-points) vs actual closed/completed items at sprint end; compute % delivered vs planned.
Watch out: If tasks change mid-sprint (scope creep), metrics get noisy. Should track “carry‑over” separately.
Improve via: Better backlog grooming, narrower sprint scope, avoiding mid-sprint changes, and encouraging a stable scope.
14. Security / Vulnerability Metrics
Number or severity of security issues or vulnerabilities detected per release or over time (by static analysis, dependency scanning, code review, etc.) Security is increasingly critical, and vulnerabilities cause user trust issues, compliance breaches, and technical debt.
How to measure:
Use static analysis tools, track security-related bug count, and track time to resolve security issues.
Watch out: Surface-level scans may miss deeper security issues; focusing only on count can ignore severity or exploitability.
Improve via: Integrate security checks into CI/CD, code reviews, automated vulnerability detection, regular audits, and dependency updates.
15. Onboarding / Ramp Time & Developer Experience Metrics
How long new hires take to become productive, developer satisfaction/retention, frequency of context switching, and developer workload distribution. Healthy scaling depends on smooth onboarding and a sustainable developer experience.
How to measure:
Track time from hire to first merged PR; number of mentoring reviews; periodic developer surveys; review load vs healthy threshold.
Watch out: Harder to quantify, many qualitative elements; results may lag. Must complement with qualitative feedback.
Improve via: Mentorship programs, documentation, pairing, balanced workloads, using tools to help new engineers, and integrating knowledge-sharing into the process.
These metrics show that if teams don't adopt a comprehensive KPI tracking approach, they can lose both velocity and code safety.
Entelligence AI helps immensely by combining automated review, contextual code analysis, and analytics dashboards that track exactly those metrics. In fact, Allocore cut review time by over 70% while catching critical bugs with our platform.
This suggests improvements across PR metrics (review time, merge throughput), code quality, and bug/defect rate, leading to faster cycle times and safer releases.
Also Read: How to Conduct a Code Quality Audit: A Comprehensive Guide
How Entelligence AI Elevates KPI Tracking and Engineering Productivity?

Entelligence AI is designed to elevate every aspect of the software development lifecycle by integrating with your team's existing workflows. Automate and provide actionable insights into key KPIs.
We also help engineering teams stay focused on what truly matters, from boosting productivity to maintaining code quality.
Here's how Entelligence AI’s features can drive KPI excellence:
Contextual Code Reviews: AI-powered, context-aware code reviews integrated directly into the IDE. This minimizes the time-to-merge and reduces back-and-forth, optimizing review throughput.
Sprint Assessments & Performance Dashboards: Entelligence AI offers AI-driven sprint assessments, giving leaders real-time insights into progress, blockers, and team productivity. This improves overall team health and workload distribution.
Team Insights & Developer Productivity Metrics: Real-time data, such as code reviews, PR performance, and defect resolution time, help managers pinpoint where further improvements are needed.
Automated Documentation & Retrospectives: Automated retrospectives help identify areas for improvement without wasting time on manual tracking.
Entelligence AI equips engineering teams with tools to automate feedback, measure KPIs in real time, and optimize workflows.
Conclusion
Tracking the right software engineering KPIs provides the clarity needed to optimize workflows, improve team collaboration, and elevate software quality. However, choosing the wrong KPIs or focusing on vanity metrics can ultimately hinder progress rather than drive it.
Entelligence AI equips teams with the tools to measure the right things in real time, delivering actionable insights that improve code quality. Teams can optimize their workflows and continuously improve through data-driven decision-making.
Ready to receive the full potential of your engineering team? Start using Entelligence AI to track your KPIs, organize your processes, and transform your software delivery from good to great.
Frequently Asked Questions (FAQs)
1. How do I choose the right KPIs for my software engineering team?
Select KPIs based on your team's goals. For speed, track cycle time and deployment frequency, while for quality, focus on change failure rate and defect resolution time. Align metrics with business objectives to drive meaningful results.
2. Can I track KPIs in real-time for remote teams?
Yes, real-time KPI for developer tracking is essential for remote teams. Tools that provide instant visibility into PR review times, deployment frequency, and team health ensure everyone stays aligned, no matter the location.
3. How can I improve code quality while maintaining high velocity?
Focus on small, frequent releases, and automate code reviews and testing. Implement continuous integration to catch issues early, ensuring high-quality code without sacrificing delivery speed.
4. What role does AI play in improving KPIs for engineering teams?
AI helps by automating data collection and providing real-time insights into key performance metrics. It identifies patterns, flags issues early, and offers recommendations to improve productivity and maintain high-quality output.
5. How do I reduce developer burnout while tracking high-performance KPIs?
To avoid burnout, track workload distribution and developer sentiment. Balancing task allocation, setting realistic goals, and ensuring sufficient rest time helps maintain performance without overloading developers.