Accelerate Metrics: How to Measure and Improve Engineering Performance
Engineering leaders face a frustrating gap: teams feel "busy" but clear, measurable value delivery is elusive. You see developer activity, yet roadmaps stall and releases remain unpredictable. Without objective data, it's hard to prove performance or fix systemic blockers.
The solution is the scientific framework of Accelerate metrics (DORA). These four key indicators provide an industry-standard measure of engineering throughput and stability. The data is clear: a 2025 DORA survey found that nearly 40% of teams achieve both high deployment frequency and low failure rates, disproving the old speed-versus-stability trade-off.
In this article, you will learn the precise formulas for calculating these metrics, the benchmarks for elite performance, and the practical steps to improve your scores.
Overview
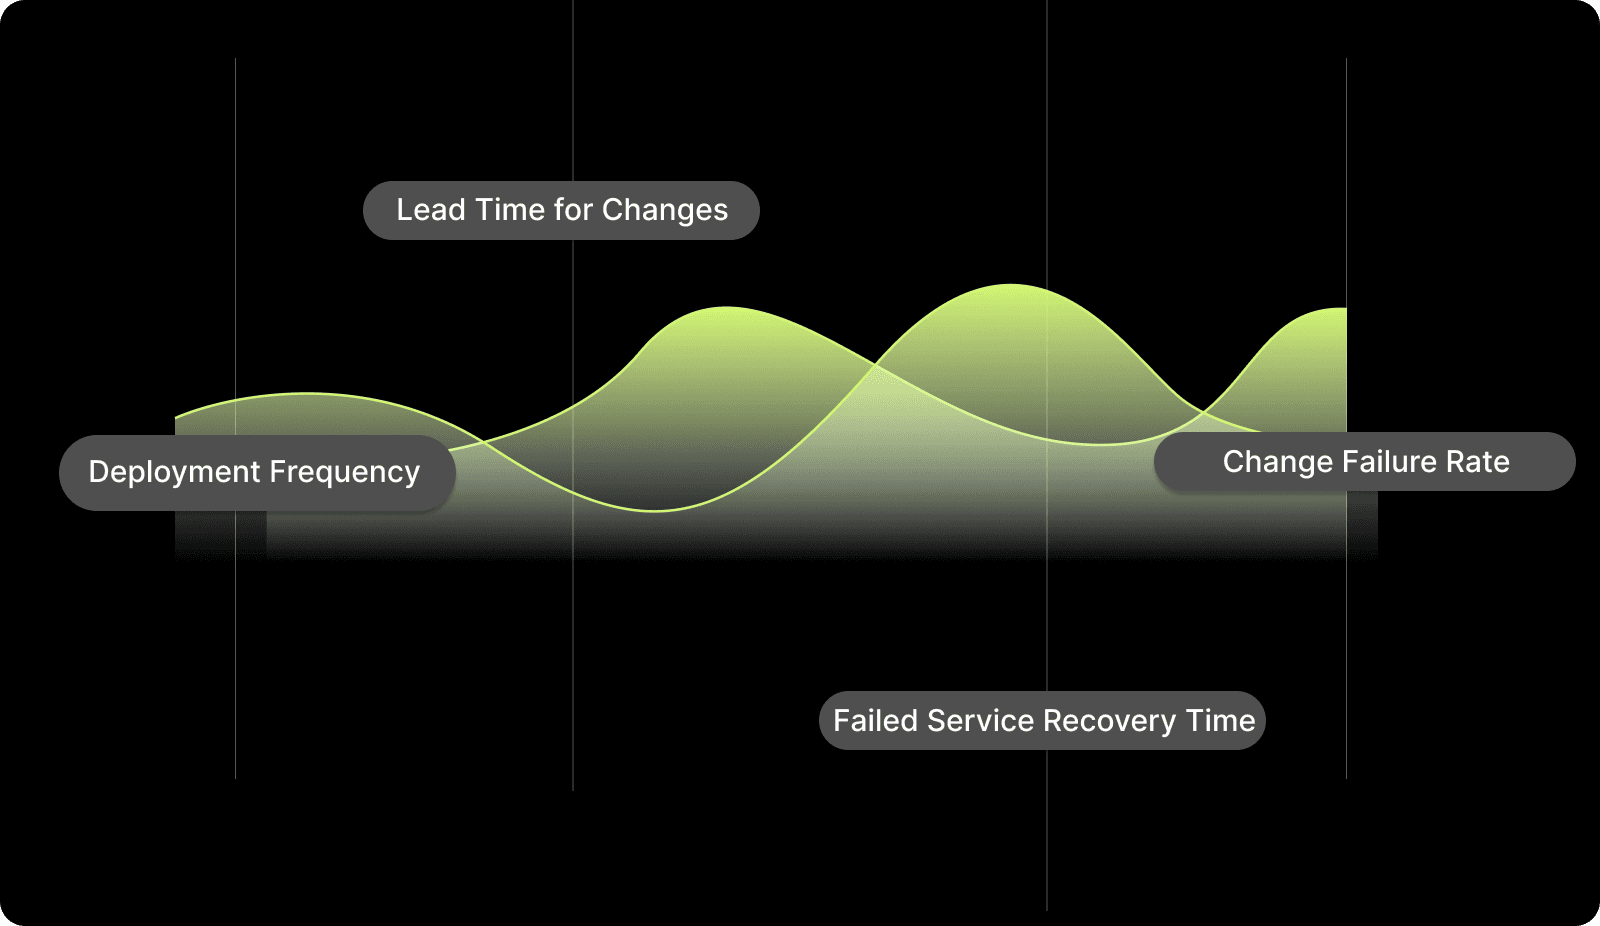
The Four Pillars: Master Deployment Frequency, Lead Time for Changes, Change Failure Rate, and Failed Service Recovery Time.
Speed and Stability: Learn why elite teams prioritize both velocity and system reliability to avoid the "velocity at all costs" trap.
Automation Requirements: Understand why manual data collection leads to "stale" insights and how to automate your DORA reporting.
Calculation Formulas: Access specific mathematical models to baseline your current performance against industry standards accurately.
Improvement Frameworks: Discover how to use "Improvement Sprints" to target specific bottlenecks in your delivery pipeline systematically.
AI Integration: See how context-aware AI reviews directly lower your Change Failure Rate by catching bugs before they reach production.
What are Accelerate Metrics?
Accelerate metrics are a set of four key performance indicators identified by the DevOps Research and Assessment (DORA) group. These metrics include Deployment Frequency (DF), Lead Time for Changes (LTFC), Change Failure Rate (CFR), and Failed Service Recovery Time (MTTR).
They were popularized in the book Accelerate and remain the most scientifically validated method for measuring software delivery performance. By tracking these signals, you can objectively measure how quickly your team delivers value and how resilient your systems remain under pressure.
To improve, you need more than surface fixes. Entelligence AI helps by finding the root cause of issues in your IDE before they become problems, cutting down on technical debt and reactive bug-fixing. Book a demo with us today to learn more.
Now, let's explore how tracking these metrics can fundamentally reshape your team's culture and strategic impact.
Why Accelerate Metrics are Important for Engineering Strategy
Implementing these metrics ensures that your engineering goals align with actual business outcomes rather than arbitrary feature counts. This framework prevents the common mistake of pushing for speed at the expense of quality, which eventually leads to system instability.
Measuring these metrics transforms your team culture in several ways:
1. Linking Engineering Output to Business Value
Accelerate metrics translate technical work into business outcomes. A short Lead Time for Changes means faster time-to-market for new features. A low Change Failure Rate means higher customer satisfaction and less firefighting.
This allows engineering leaders to communicate their team's impact in terms that every stakeholder understands.
2. Identifying Team Burnout Risks
Metrics can act as an early warning system. A sudden spike in Change Failure Rate might indicate rushed work or cutting corners. A lengthening Time to Restore Service could signal alert fatigue or poor documentation. These signals allow you to address process issues before they lead to team exhaustion.
3. Building a Culture of Continuous Improvement
When teams have clear, shared metrics, retrospectives move from anecdotal discussions to data-driven problem-solving. You can ask, "Our Lead Time increased this sprint. What specific blockers caused that?"

This creates a blame-free environment focused on systemic improvement rather than individual performance.
Also read: How Agile Metrics Improve Leadership Outcomes
Predictable delivery cycles depend on the health of your underlying metrics and the tools that track them.
4 Key Accelerate Metrics Your DevOps Team Needs to Measure
Mastering the four pillars of the DORA framework requires a deep dive into how each metric is captured and optimized in a real-world environment.
High-performing teams aim for these specific industry benchmarks:
1. Deployment Frequency
Deployment Frequency measures how often your organization successfully releases code to a production environment. For elite teams, this is an "on-demand" activity that happens multiple times per day rather than a scheduled weekly event.
According to the 2025 DORA survey:
16.2% of teams deploy on demand (multiple times per day)
Over 44% deploy at least weekly
Only 3.6% deploy less than once every six months
A high frequency indicates that your team has mastered small, incremental changes that reduce the risk of any single release.
How to measure: Track the total number of successful production deployments over a 30-day period.
Divide the total deployments by the number of working days in that window.
How to improve:
Break down large features into smaller, independent user stories.
Implement automated CI/CD pipelines to remove manual gatekeeping.
Use feature flags to decouple code deployment from the actual feature release.
Adopt a trunk-based development model to avoid long-lived merge conflicts.
Automate your regression testing suite to gain confidence in every commit.
Set a goal to increase your daily deployment count by 10% each quarter.
2. Lead Time for Changes
Lead Time for Changes tracks the duration from the moment a developer makes their first commit to the moment that code is running in production. This metric highlights the efficiency of your code review and testing processes.
DORA’s data shows:
56.4% of teams deploy changes within one week or less
Only 9.4% achieve lead times under one hour, highlighting how review queues and manual approvals remain the dominant bottleneck, not coding speed.
Long lead times usually point to "wait states" where code sits idle in a queue for a human reviewer.
How to measure:
Record the timestamp of the first commit in a branch.
Record the timestamp when that branch is successfully deployed to production.
How to improve:
Reduce the size of pull requests to make reviews faster and more accurate.
Implement a "Review-First" culture where PRs are prioritized over starting new work.
Use AI-powered code reviews to catch style and security issues automatically.
Automate the handoff between the development, staging, and production environments.
Monitor and eliminate the "Pickup Time" gap between PR creation and review start.
Standardize your environment configurations to prevent "it works on my machine" delays.
3. Change Failure Rate
Change Failure Rate is the percentage of deployments that result in a failure, such as a service outage, a rollback, or a critical bug. This is the ultimate measure of your delivery quality. Teams exceeding 32% CFR are strongly associated with unstable delivery environments and high burnout.
Elite performers maintain a CFR of under 15%, ensuring that speed does not come at the cost of the user experience.
How to measure:
Count the total number of production deployments in a specific timeframe.
Count how many of those deployments required a fix, rollback, or patch.
How to improve:
Enhance your unit and integration test coverage for every new PR.
Implement automated security scanning within the IDE to catch flaws early.
Use canary deployments to test new code on a small percentage of users first.
Require peer reviews for every change, regardless of the ticket size.
Conduct post-mortems for every failure to identify and fix the root cause.
Integrate context-aware AI tools to ensure code follows architectural patterns.
4. Failed Service Recovery Time
Failed Service Recovery Time, often called MTTR, measures how long it takes to restore service after an incident or production failure. This metric reflects your team's ability to diagnose problems and deploy fixes under pressure. Research shows that 56.5% of teams restore service in under one day. 21.3% recover in under one hour, minimizing customer-visible impact.
A low recovery time is essential for maintaining customer trust during inevitable technical glitches.
How to measure:
Log the timestamp when a production incident is first detected.
Log the timestamp when the service is fully restored and verified.
How to improve:
Invest in strong observability and monitoring tools for real-time alerts.
Practice automated rollbacks so you can revert a failed change in seconds.
Create "Runbooks" for common failure scenarios to guide the response team.
Ensure that every developer has the context needed to debug their own services.
Improve internal documentation to help responders find historical fix data.
Use automated health checks to detect failures before users report them.
Maintaining a balance across these four signals is the key to sustainable engineering growth.

Also read: How to Measure and Improve Engineering Productivity Step by Step
4 Steps to Implement Accelerate Metrics
Setting up a DORA program requires a structured approach to data collection and team alignment to ensure the results lead to actual change.
Use this step-by-step framework to move your team from "Medium" to "Elite" status:
Step 1: Mapping Your Data Sources
You must connect your version control system, CI/CD pipeline, and incident management tools to create a single source of truth. Without these integrations, your data will be fragmented and unreliable.
Most teams start by pulling data from GitHub for commit history and PagerDuty for recovery times.
Connect GitHub or GitLab to track commit and merge timestamps.
Integrate Jira or Linear to align deployments with specific product goals.
Link PagerDuty or Opsgenie to capture incident detection and resolution data.
Ensure all tools use a consistent naming convention for services and repos.
Map your deployment logs to your version control tags for accurate tracking.
Step 2: Calculating Your Baseline (The Formulas)
Before you can improve, you must know where you stand today by applying the standard DORA formulas to your last 90 days of work. This baseline prevents you from setting unrealistic goals that ignore your current technical constraints.
Calculate LTFC using: Deployment Time - First Commit Time
Calculate CFR using: (Number of Failed Deployments) / (Total Deployments) * 100.
Calculate DF by averaging deployments per day across your primary repositories.
Calculate MTTR by averaging the resolution time of all P1 and P2 incidents.
Step 3: Setting Improvement Sprints
Pick one metric that is currently underperforming and dedicate a sprint or a quarter to moving that specific number. Trying to improve all four at once often leads to a lack of focus and minimal results.
For example, if your CFR is high, focus your efforts on testing automation and code review quality.
Identify the metric with the biggest gap compared to elite benchmarks.
Set a realistic target (e.g., reducing MTTR by 15% in three months).
Allocate engineering hours specifically for process and tool improvements.
Review the progress of your improvement sprint in every retrospective.
Pivot your strategy if the metrics do not show signs of positive change.
Step 4: Managing Real-World Hurdles
Be prepared for scenarios like "Flaky Deployments," where a release only partially succeeds or affects only a subset of users. You must also account for "Long-Lived Branches" required for major architectural refactors, which can artificially inflate your lead time.
Define a "failed deployment" clearly to avoid arguments during CFR calculation.
Exclude long-term architectural research branches from your standard LTFC reports.
Use a "weighted average" for teams that handle vastly different project sizes.
Account for manual approval steps that are outside of the engineering team's control.
To scale effectively, your teams need a repeatable framework. Entelligence AI provides the contextual intelligence to maintain this structure safely across thousands of repos. Book a demo to see how it ensures individual work aligns with your strategic goals.
Consistency in data collection is what separates high-performing leaders from those who rely on gut feeling.
Best Practices for Improving Your Scores
Improving your Accelerate metrics requires more than just faster typing; it requires a fundamental shift in how you build and release software.
Sustainable improvement requires these technical and cultural shifts:
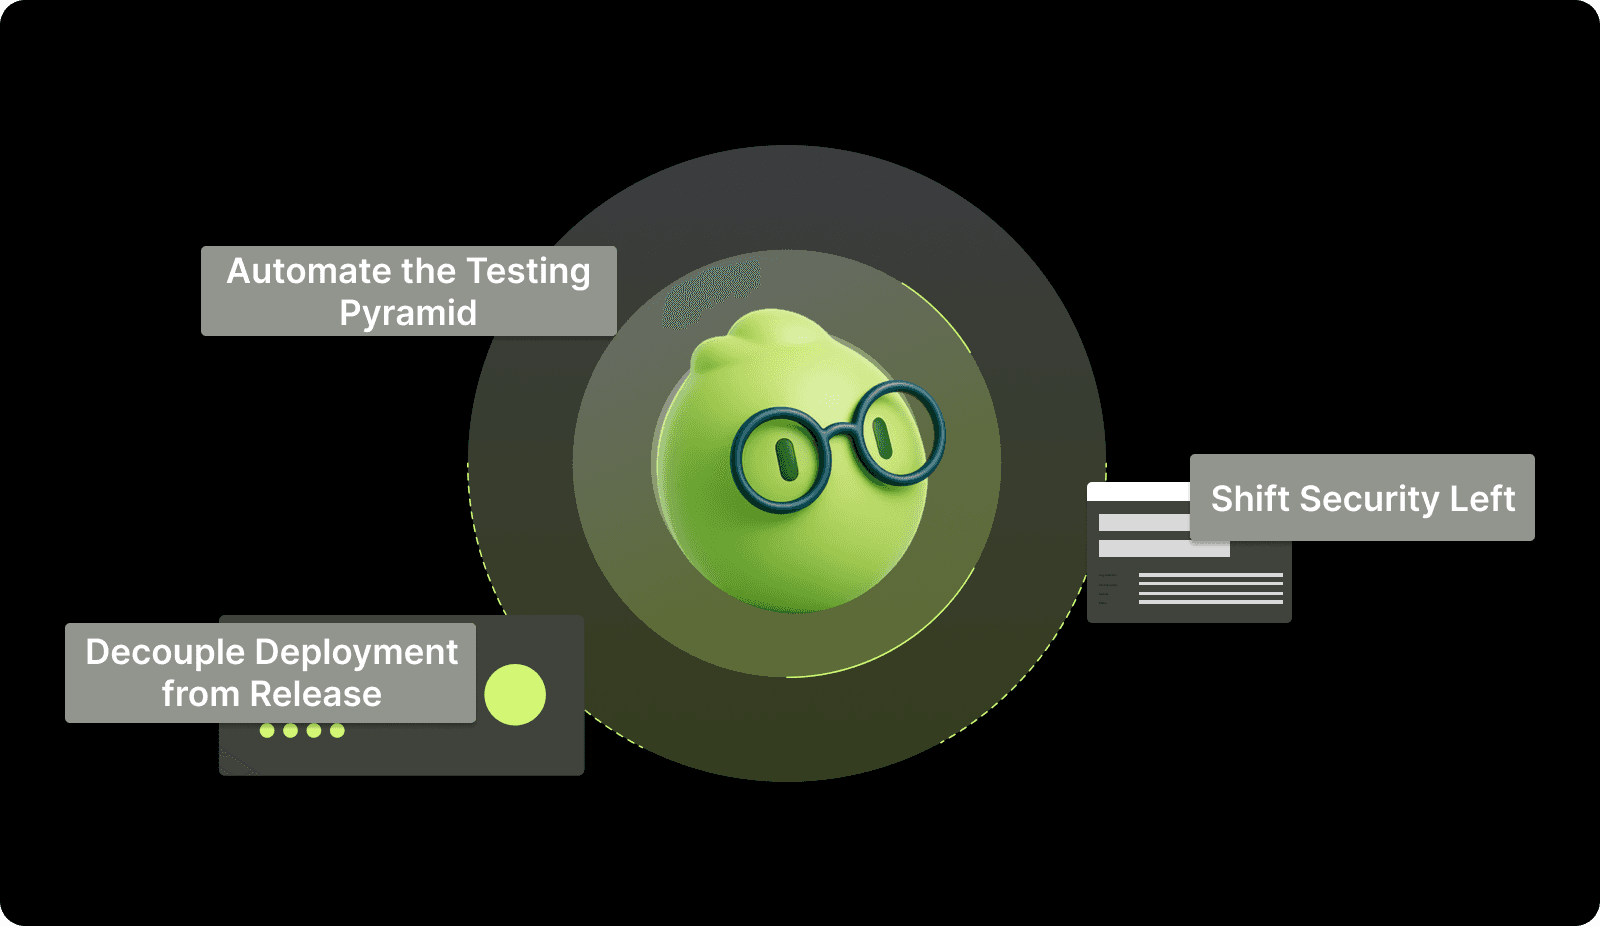
1. Decouple Deployment from Release
Using feature flags allows your team to push code to production without making it visible to the end user. This practice reduces the pressure of each deployment and allows you to test code in the real environment safely.
It directly improves your deployment frequency and lead time by removing the need for complex release coordination.
Impact: Drastically lowers Lead Time for Changes and increases Deployment Frequency.
2. Automate the Testing Pyramid
A strong suite of automated unit, integration, and end-to-end tests acts as a safety net for your developers. Automation catches errors in the "Coding Time" phase, preventing them from ever becoming a failure in production.
This shift allows you to move faster with the confidence that your quality standards are being enforced by the system.
Impact: Leads to a significant reduction in Change Failure Rate and higher developer confidence.
3. Shift Security Left
By integrating security scanning and vulnerability detection directly into the developer's IDE, you prevent critical flaws from reaching the merge stage. Addressing security early in the lifecycle is much cheaper and faster than fixing a breach in production.
This practice keeps your recovery time low by ensuring your code is resilient from the first commit.
Impact: Lowers Failed Service Recovery Time and prevents critical production outages.
Focusing on these practices ensures that your team remains elite even as the complexity of your codebase grows.
Also read: How to Measure Developer Productivity Effectively
Common Mistakes When Measuring Accelerate Metrics
Even with the right framework, several pitfalls can undermine the effectiveness of your DORA program and damage team culture.
Avoid these pitfalls to ensure your data remains a tool for growth, not a weapon:
1. Using Metrics for Performance Reviews
The moment you use Accelerate metrics to punish individual developers, the team will begin to "game" the numbers. Developers might open hundreds of tiny, meaningless PRs to boost deployment frequency or stop reporting minor bugs to hide their change failure rate. This destroys the integrity of your data and creates a culture of fear.
Solution: Use these metrics to identify process bottlenecks and team-level challenges rather than evaluating individual people.
2. Over-Optimizing One Metric
Focusing solely on deployment frequency can lead your team to skip tests and ignore security reviews just to "hit the numbers." This imbalance eventually causes the change failure rate to skyrocket, resulting in more downtime and customer dissatisfaction.
You must track all four metrics in tandem to maintain a healthy balance between speed and stability.
Solution: Set goals that require a balance, such as increasing velocity while maintaining a stable Change Failure Rate.
3. Manual Data Collection
Relying on developers to manually log their commit times or deployment failures in a spreadsheet is a recipe for disaster. Human error and the "overhead" of manual tracking will lead to inaccurate data that no one in the organization trusts.
If the data isn't automated and real-time, it cannot provide the strategic clarity needed for decision-making.
Solution: Automate the data pipeline using an engineering intelligence platform that integrates directly with your existing tech stack.
Maintaining the accuracy and neutrality of your data is essential for long-term engineering success.
Also read: Top 10 Engineering Metrics to Track in 2025
Entelligence AI: Automating Your DORA Dashboards
The primary obstacle to mastering Accelerate metrics is the fragmentation of engineering data across disparate tools like GitHub, Jira, and Slack. Manually tracking these handoffs is time-consuming and prone to human error, often resulting in reports that are obsolete by the time they reach leadership.
This lack of real-time visibility prevents you from identifying active blockers and stalls your team's path to elite performance. Entelligence AI unifies these signals to provide a real-time, automated view of your engineering health.
Our platform integrates directly into your existing workflow to turn raw activity into the strategic clarity you need to lead. Here’s why you should choose us:
Automated Sprint Assessments: Track your planned vs. completed tasks and surface blockers that are skewing your lead time.
Context-Aware PR Reviews: Catch architectural anti-patterns and bugs in the IDE to lower your Change Failure Rate.
Org-Wide Visibility Dashboards: View high-level trends and team-level productivity without chasing manual reports from multiple leads.
Entelligence AI turns fragmented data into the strategic clarity you need to lead, ensuring your organization ships faster and with higher quality.
Conclusion
Mastering Accelerate metrics is the most effective path toward building a high-performing engineering organization that delivers consistent value. By tracking Deployment Frequency, Lead Time, Change Failure Rate, and Recovery Time, you move from anecdotal management to a data-driven strategy.
This scientific approach allows you to balance the need for speed with the necessity of system stability, ensuring long-term success.
Entelligence AI serves as your companion in this journey, providing the tools and insights needed to automate your DORA reporting and optimize your delivery pipeline. With real-time visibility and context-aware intelligence, you can empower your team to reach elite performance standards.
Ready to gain total clarity over your engineering performance and lead your team to elite status? Book a demo with Entelligence AI today.
FAQs
Q. What is the difference between DORA metrics and Accelerate metrics?
There is actually no difference between the two; they refer to the same set of four indicators. The term "Accelerate metrics" comes from the book Accelerate, which detailed the research, while "DORA metrics" refers to the group (DevOps Research and Assessment) that conducted the study.
Both terms are used interchangeably by engineering leaders to describe the standard for high-performing software teams.
Q. How do I choose which accelerate metric to improve first?
We recommend looking for the metric that is currently the furthest away from the "Elite" benchmark in your organization. If your deployments take weeks (Lead Time), focus on breaking down PR size and automating reviews.
If your deployments are fast but constantly breaking (Change Failure Rate), prioritize testing automation and security scanning before trying to increase speed further.
Q. Can small startups benefit from accelerate metrics?
Yes, startups benefit significantly because these metrics help prevent technical debt from piling up during the early stages of growth. While you may not need the same level of granular reporting as an enterprise, tracking these signals ensures you build a culture of quality from day one. It also provides founders with objective proof that the engineering team is moving as fast as possible.
Q. How do accelerate metrics relate to developer productivity?
Accelerate metrics focus on "Outcome" rather than "Output," meaning they measure the value delivered rather than the number of lines of code written. When these metrics improve, it usually means developers are spending less time on manual overhead and "wait states" and more time on actual problem-solving. This shift leads to higher developer satisfaction and overall organizational productivity.
Q. What is a "good" Change Failure Rate for SaaS companies?
High-performing SaaS companies typically aim for a Change Failure Rate between 0% and 15%. If your rate is higher than 15%, it indicates that your quality gates are insufficient or your PRs are too large to review effectively. Maintaining a low CFR is essential for preserving customer trust and preventing your senior engineers from being constantly stuck in "emergency fix" mode.