


Top 16 Developer Experience Metrics Every Engineering Leader Should Track
Your deployment frequency looks great. Your sprint velocity is up. But half your senior developers just handed in their notice.
Something is broken, and your traditional engineering metrics missed it completely.
According to the 2025 JetBrains Developer Ecosystem Survey of 24,534 developers, 66% don't believe current metrics accurately reflect their actual contributions. Your team ships code on time, but they are burned out, frustrated, and actively job hunting. The problem is not that you are measuring the wrong things. You are just not measuring enough of the right things.
This is where developer experience metrics change the game. In this guide, you will learn exactly which DevEx metrics matter, how to measure them accurately, and most importantly, how to use them to build an engineering organization where developers actually want to work.
Key Takeaways
Developer experience metrics capture what traditional metrics miss. They surface friction, cognitive load, and dissatisfaction that don’t appear in velocity or deployment data.
DevEx metrics function as leading indicators of team health. Shifts in flow, review delays, and sentiment signal delivery and retention risk early.
Developer experience must be measured across multiple dimensions. Workflow efficiency, code reviews, cognitive load, collaboration, and sentiment together explain performance.
Accurate DevEx measurement depends on automation and context. Instrument tools instead of people, establish baselines, and pair metrics with qualitative insight.
The real value of DevEx metrics comes from action. Teams that act on these signals reduce friction, ship sustainably, and retain engineers longer.
What Are Developer Experience Metrics?
Developer experience metrics are signals that show how easily developers can build, review, ship, and maintain software inside an engineering organization. Instead of measuring output alone, these metrics focus on the friction, flow, and feedback loops developers encounter in their day-to-day work.
For engineering leaders, developer experience metrics answer a critical question:
Are our systems and processes helping developers do their best work, or slowing them down?
At a high level, DevEx metrics help you understand:
How smoothly does the workflow flow from idea to production
Where developers lose time due to bottlenecks, rework, or waiting
How much cognitive load do tools, processes, and context switching create
How collaboration and reviews affect delivery speed and quality
Unlike traditional productivity metrics, developer experience metrics capture what it feels like to do the work and not just how much work gets done.
Why Measuring Developer Experience Matters for Engineering Teams?
Developer experience metrics provide insight into how work moves through engineering teams and how developers interact with systems and processes.
Here’s why DevEx metrics deserve the same attention as sprint velocity:
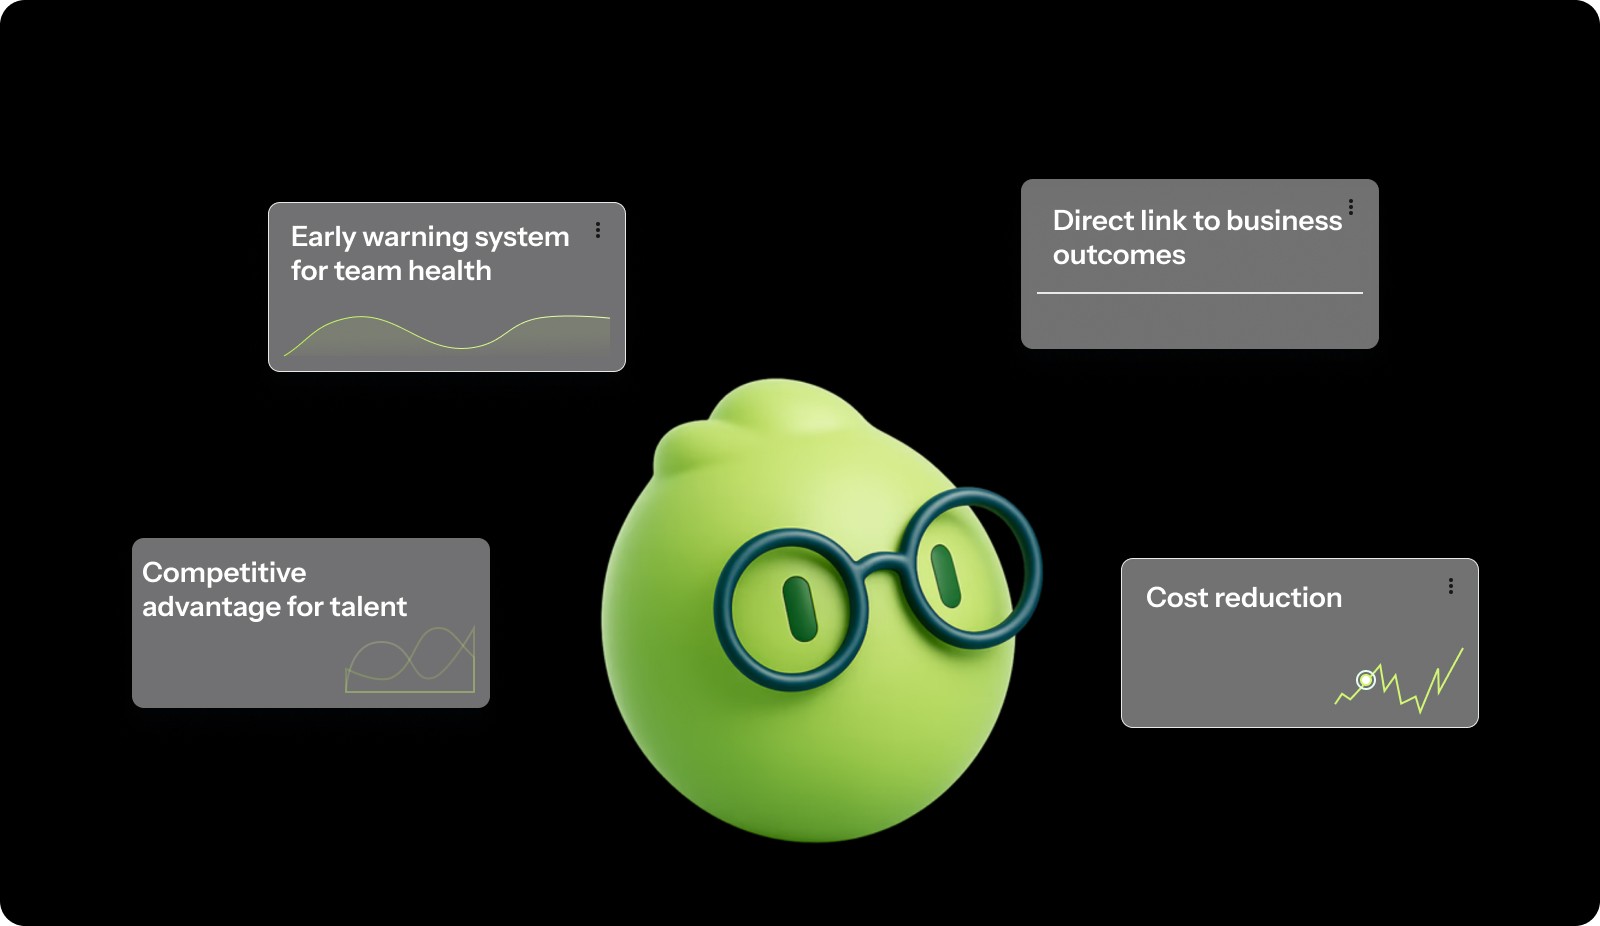
Early warning system for team health: DevEx metrics catch problems before they become crises. When developers start reporting increased cognitive load or decreased satisfaction, you know something is wrong long before productivity drops or people quit.
Direct link to business outcomes: Developers themselves highlight both technical and non-technical factors as critical to their performance, with internal collaboration, communication, and clarity now just as important as faster CI pipelines or better IDEs. Better DevEx directly translates to faster delivery, fewer bugs, and more innovation.
Competitive advantage for talent: In a market where top engineers have their pick of employers, companies that offer superior developer experiences win the talent war. Developers talk. They share which companies have great tooling, clear processes, and respect for their time.
Cost reduction: Poor DevEx is expensive. Research shows that developers need an average of 23 minutes to fully rebuild their focus after an interruption. Multiply that by dozens of interruptions per day across your entire team. You are paying senior engineers to repeatedly rebuild the same mental models.
You cannot fix what you do not measure. DevEx metrics give you the data you need to make informed decisions about where to invest in tooling, process improvements, and team structure.
Developer Experience Metrics vs Traditional Engineering Metrics vs Productivity Metrics: Key Differences
Engineering teams use various metrics to understand how work is progressing. While these metrics are often discussed together, they measure very different aspects of engineering performance.
Here is how these metric types differ:
Aspect | Traditional Engineering Metrics | Productivity Metrics | Developer Experience Metrics |
Focus | System outcomes and delivery reliability. | Output and activity levels. | Process quality and developer well-being. |
What they measure | Deployments, change failure rate, MTTR | Commits, tickets closed, story points. | Cognitive load, flow time, review quality, and satisfaction. |
Time horizon | Lagging indicators (what already happened) | Near-term activity indicators | Leading indicators (what will happen next) |
Primary question | Did our systems remain stable while shipping? | How much work did we complete? | How efficiently and sustainably did we ship it? |
Typical users | Executives, platform teams. | Project managers, delivery leads. | Engineering managers, team leads. |
Warning signs | Incidents, rollbacks, outages | Burnout is hidden behind high output. | Frustration, context switching, and long wait times. |
For engineering leaders, this distinction becomes critical when making decisions based on performance data. Productivity and traditional engineering metrics describe results, but they rarely explain the underlying conditions that produced those results. Developer experience metrics fill that gap by revealing friction early, before it shows up as missed deadlines, declining quality, or attrition.
Used together, these metrics provide a more complete picture of engineering health. Used in isolation, they can create false confidence or drive short-term optimization at the expense of long-term sustainability.

Key Dimensions of Developer Experience
Developer experience is not a single metric you can track in a single dashboard. It is a multidimensional concept that spans how developers work, collaborate, think, and feel throughout their entire development cycle.
Understanding these dimensions helps you target your improvements effectively rather than making blind changes and hoping they help.
Workflow Efficiency and Flow
This dimension measures how smoothly work moves through your development process without unnecessary delays or interruptions.
Flow state is the holy grail of developer productivity. It is when developers are fully immersed in solving problems, making steady progress, and producing their best work. But flow is fragile. Research from UC Irvine shows that developers need an average of 23 minutes to fully rebuild their focus after an interruption.
Key aspects of workflow efficiency:
Time spent in uninterrupted blocks of focused work.
Number of handoffs required to complete a task.
Wait times for reviews, approvals, or dependencies.
Ability to deploy changes without manual intervention.
When workflow efficiency is high, developers can start a task and complete it without constantly switching tools, waiting on others, or dealing with brittle processes.
Code Quality and Review Experience
Code reviews are where knowledge transfer happens, quality improves, and teams align on standards. They are also a massive source of friction when done poorly.
The review experience encompasses the entire cycle from opening a PR to merging code. It includes review wait times, the quality of feedback, the number of review cycles, and whether reviewers have enough context to provide meaningful input.
Critical elements of review experience:
Time until first review response.
Quality and clarity of review feedback.
Number of review cycles before approval.
PR size and reviewability.
To assess whether code quality is improving or quietly degrading, you need visibility before issues reach review. You can use tools like Entelligence AI to surface contextual insights directly in the IDE, helping you catch quality concerns early and keep reviews focused on meaningful feedback.
Cognitive Load and Focus
Cognitive load measures the mental effort required to understand systems, complete tasks, and maintain context. High cognitive load exhausts developers even when they are not writing much code.
Modern software systems are complex. Developers must understand business logic, technical architecture, deployment processes, and team conventions simultaneously. Every additional piece of information they must hold in working memory increases cognitive load.
Sources of cognitive load:
Complexity of the codebase and architecture.
Frequency of context switching between tasks.
Quality and accessibility of documentation.
The number of tools and systems developers must navigate.
Collaboration and Tooling
Developers rarely work in isolation. They depend on teammates, rely on shared tools, and navigate organizational processes. The quality of these collaboration mechanisms directly impacts their effectiveness.
Collaboration friction shows up as unclear communication channels, siloed knowledge, fragmented tools, and dependencies that create bottlenecks. When collaboration tools work well, developers know who to ask, where to find information, and how to unblock themselves.
Collaboration quality indicators:
Clarity of team communication channels.
Accessibility of expertise and knowledge.
Integration between development tools.
Onboarding effectiveness for new team members.
Developer Sentiment and Retention
Happy developers are productive developers. But happiness is not just about free snacks and ping pong tables. It is about feeling effective, valued, and empowered to do great work.
Developer sentiment captures satisfaction with work, confidence in leadership, belief in the product, and sense of growth. When sentiment trends negative, productivity follows.
Sentiment indicators to watch:
Overall job satisfaction scores.
Confidence in team direction and leadership.
Perception of psychological safety.
Intent to stay with the organization.
These dimensions describe where developer experience breaks down. The metrics that follow show how to detect those breakdowns early and act on them.
Also read: Understanding Velocity in Agile Software Development
16 Essential Developer Experience Metrics to Track
These metrics are not a checklist. They are signals. Tracked together, they tell you where developer time, attention, and confidence are being lost.
Team Performance Metrics
These metrics show how reliably work moves from commit to production and how safe developers feel pushing changes.
1. Deployment Frequency
Deployment frequency is the frequency with which developers deliver completed work to users.
How leaders use it
Track successful production deployments over a consistent time period.
Review trends weekly, not day by day.
What it reveals
Increasing frequency with stable failure rates indicates healthier automation and smaller change sets.
Low frequency usually points to manual steps, large batches, or risk avoidance.
High frequency combined with rising failures suggests process shortcuts that will increase developer stress.
2. Lead Time for Changes
Lead time captures how long developers wait between writing code and seeing it in production.
How to measure
Tag commits to tickets.
Track time from first commit to production.
Use median values to avoid distortion from outliers.
What it shows
Long lead times delay feedback and slow learning.
High deployment frequency with long lead time often indicates queuing and batching.
Excessive waiting reduces developer ownership and increases frustration.
3. Mean Time to Recovery (MTTR)
MTTR shows how quickly teams can restore service after incidents.
How to calculate
Total downtime divided by the number of incidents.
What it reveals
Low MTTR indicates effective observability and incident response.
High MTTR increases deployment hesitation and friction in reviews.
Teams with fast recovery tend to ship more confidently.
4. Change Failure Rate
This measures the percentage of deployments that require rollback or urgent fixes.
How to track
Failed deployments divided by total deployments
What it reveals
Rates under 5 percent indicate balanced speed and reliability.
Higher rates usually mean insufficient validation or rushed releases.
Persistent failures shift developer effort from building to firefighting.
Code Review and Quality Metrics
These metrics surface collaboration bottlenecks that slow delivery and increase cognitive overhead.
5. Time to Review
Time to review measures how long pull requests wait before receiving initial feedback.
How leaders interpret it
Under 4 hours indicates healthy ownership and capacity.
Over 24 hours suggests a review load imbalance or unclear responsibility.
Why it matters
Delayed reviews increase context switching.
Fast reviews keep developers aligned and reduce rework.
6. Time to Merge
This captures the full lifecycle of a pull request from creation to merge.
What to monitor
Most changes should merge within 24 hours.
Repeated multi-day merges signal oversized changes or approval bottlenecks.
Operational note
Track hotfix merges separately.
If urgent fixes move at the same pace as normal work, your process lacks flexibility.
7. Code Complexity
Complexity metrics reflect how difficult the codebase is to understand and modify.
How to use it
Track cyclomatic complexity by module or service.
Flag functions above the agreed thresholds for review.
Keep an eye on
Rising complexity trends are expected to lead to slower onboarding and higher defect rates.
Flat or declining trends indicate active debt management.
8. Defect Density
Defect density highlights areas generating rework and quality issues.
How to apply it
Track defects per 1,000 lines of code.
Segment by component or service.
What it reveals
Spikes in specific areas usually point to unclear ownership or architectural strain.
New features naturally show higher density; legacy hot spots require intervention.
Cognitive Load and Flow Metrics
These metrics make invisible friction visible by showing how much mental overhead developers carry.
9. Context Switching Frequency
This reflects how often developers are forced to shift attention between tasks, tools, or priorities.
How to observe
Number of active work items per developer.
Interruptions from meetings during focus time.
Tool switching between the IDE, chat, and ticket systems.
Expectations for immediate responses.
What it indicates
High switching correlates with slower delivery and higher error rates.
Persistent interruption usually stems from process design, not individual behavior.
10. Rework Rate
Rework rate shows how much effort is spent revisiting recent work.
How to track
Percentage of code modified within a fixed window, such as 21 days
What it reveals
Rates above 15 percent suggest unclear requirements or rushed design decisions.
High rework reduces developer trust in planning and estimates.
11. Documentation Coverage
Documentation coverage reflects how accessible system knowledge is.
What to assess
Coverage of critical systems and APIs.
Freshness based on last update.
Actual usage through search or page views.
Leadership insight
Missing documentation slows onboarding and incident response.
Unused documentation signals wasted maintenance effort.
Collaboration and Tooling Metrics
These metrics highlight delays caused by dependencies and by the organization's structure.
12. Dependency Wait Time
This measures how long work remains blocked by external dependencies.
How to track
Time spent in blocked status on tickets
What it reveals
High wait time indicates excessive coupling between teams.
Developers experience this as idle time even though capacity is available.
13. Onboarding Time
Onboarding time shows how quickly new engineers can contribute meaningful work.
Key milestones
Environment setup
First pull request
First production deployment
Independent contribution
What it indicates
Long onboarding increases cost and reduces early confidence.
Fast onboarding usually reflects strong documentation and clear ownership.
14. Time to First Commit
This metric captures how accessible your system feels to new developers.
What leaders watch
First commit within days signals low friction.
Delays usually point to setup issues or unclear starter tasks.
Developer Sentiment and Retention Metrics
These metrics provide early warning signals before delivery metrics degrade.
15. Developer Satisfaction Score
This captures how developers perceive their tools, workload, and growth.
Ask about
Tooling satisfaction.
Time for quality work.
Feeling valued.
Growth and learning.
Best practice
Survey quarterly.
Investigate any 10-point drop immediately.
Something changed, and developers feel it first.
16. Employee Retention Rate
Retention reflects the long-term outcome of developer experience.
Formula
(Developers at period end / Developers at period start) × 100
Targets
Aim for 85 percent or higher annually.
A reading below 70 percent signals cultural or tooling failures.
Leading indicator
Track resignation reasons.
Repeated themes point to systemic DevEx issues, not individual problems.
Taken together, these metrics reveal where developer time, focus, and confidence are quietly lost across everyday work.

How to Measure Developer Experience Effectively?
Knowing which metrics to track is only half the battle. Measuring them accurately without creating additional overhead is the real challenge.
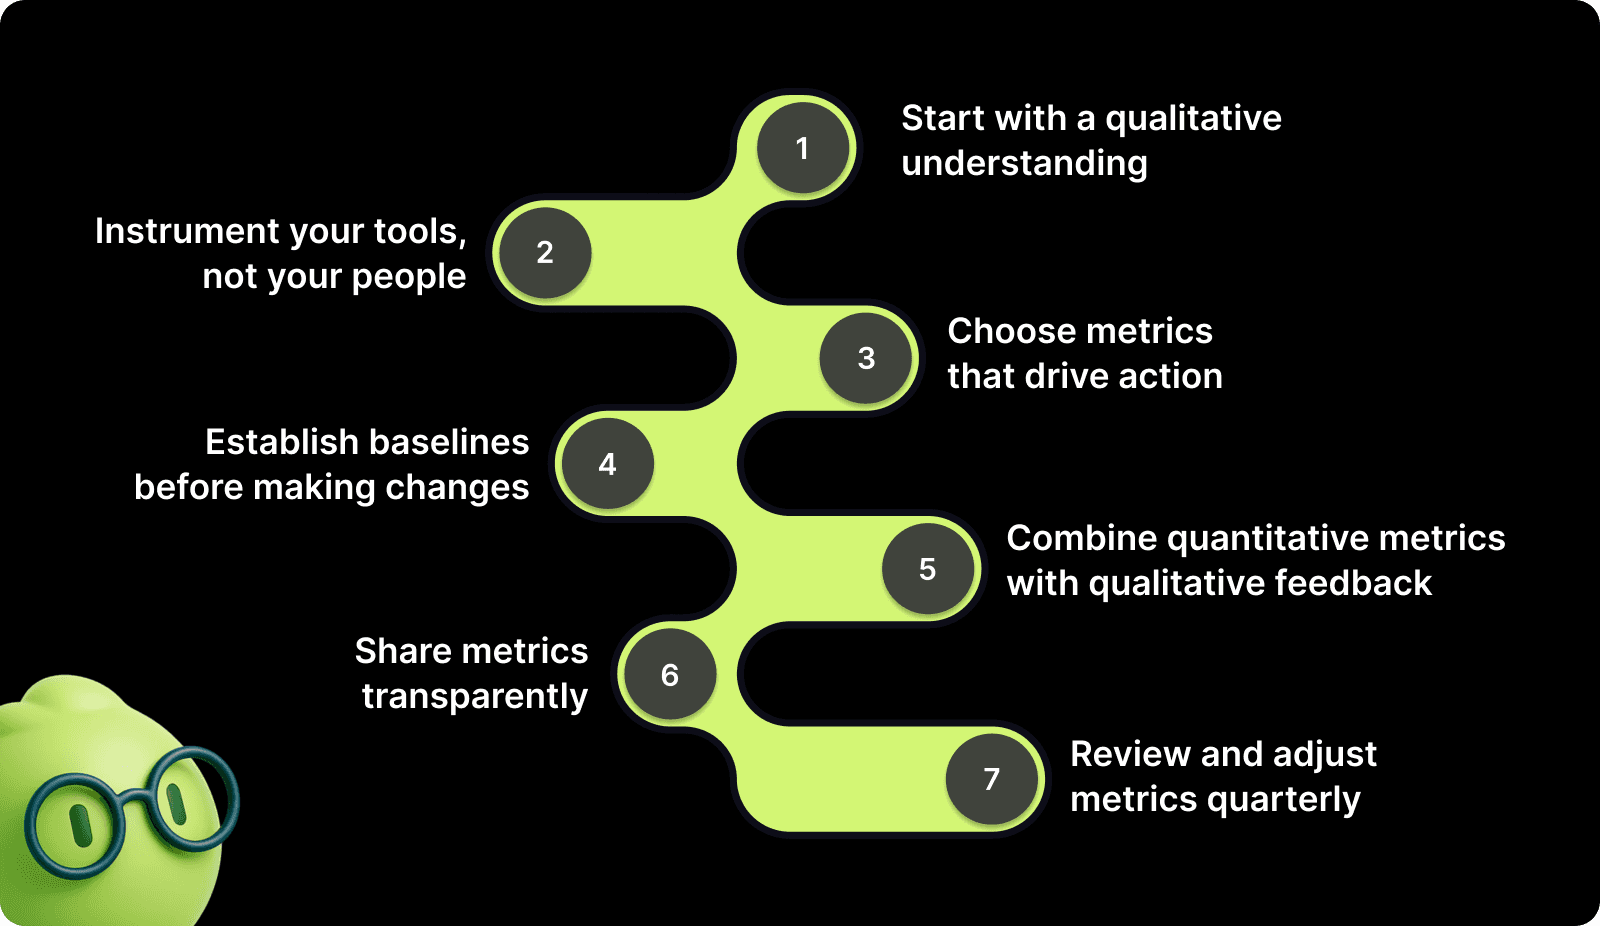
Step 1: Start with a qualitative understanding
Before diving into quantitative metrics, talk to your developers. Run a survey or hold listening sessions to understand their biggest frustrations. Ask:
What slows you down most during a typical day?
What tools or processes cause the most friction?
When do you feel most productive? When do you feel least productive?
This qualitative baseline tells you which metrics will actually matter for your team.
Step 2: Instrument your tools, not your people
The best DevEx measurement is invisible. Instrument your CI/CD pipeline, version control, and project management tools to automatically capture data. Never ask developers to manually log their time or track their own interruptions. That just adds cognitive load.
Connect GitHub for PR metrics, Jira for cycle times, and your deployment tooling for frequency and failure rates. The data should flow automatically.
Step 3: Choose metrics that drive action
Only track metrics you will act on. Every metric you measure should answer a specific question and point toward a concrete improvement. If you would not change anything based on a metric's value, stop tracking it.
For example, if Time to Review is consistently high, the action is clear: implement PR rotation, set review SLAs, or reduce PR size.
Step 4: Establish baselines before making changes
Measure your current state for at least 2-4 weeks before implementing improvements. You need baseline data to know if your changes actually work. Consistently track metrics using the same methodology.
Step 5: Combine quantitative metrics with qualitative feedback
Numbers tell you what changed. People tell you why. When deployment frequency increases but satisfaction drops, the quantitative data shows a problem, while qualitative feedback reveals the root cause.
Use regular retrospectives, pulse surveys, and one-on-ones to add context to your metrics. Ask developers to explain anomalies in the data.
Step 6: Share metrics transparently
DevEx metrics should not be secret leadership dashboards. Share them with your entire team so everyone understands the problems and sees the impact of improvements.
Transparency builds trust and creates shared accountability for maintaining good developer experience.
Step 7: Review and adjust metrics quarterly
Your needs change as your team grows and your product evolves. Review your DevEx metrics quarterly to ensure you are still measuring what matters. Drop metrics that no longer drive decisions. Add metrics that address new friction points.
Tracking developer experience metrics shouldn't become another friction point for your team. Entelligence AI automatically captures code review times, PR quality, and team velocity without adding manual overhead to your workflow. Contextual insights highlight friction points before they impact velocity, giving you the visibility to act fast. Book a demo to see how it can turn DevEx data into actionable improvements.
Also read: Understanding Code Scanning for Vulnerabilities
Best Practices for Improving Developer Experience
Measuring DevEx is pointless without acting on what you discover. Here are proven approaches for translating metrics into meaningful improvements.
Reduce Context Switching Through Focused Work Blocks
Create protected focus time where developers can work uninterrupted on complex problems. This means no meetings, no Slack expectations, no "quick questions."
Designate core focus hours (like 9 AM to 12 PM) as meeting-free zones.
Set Slack status expectations during focus time.
Train managers to protect their team's focus blocks
Optimize Code Review Processes
Fast, high-quality reviews keep work flowing without sacrificing quality. This requires both process changes and cultural shifts.
Tactical improvements:
Limit PR size to 200-300 lines whenever possible.
Implement a PR rotation to prevent reviews from piling up on senior engineers.
Set review SLAs (like "first response within 4 hours").
Use AI code review tools to catch basic issues before human review.
Invest in Documentation as Code
Documentation should live in version control, update automatically where possible, and be as easy to find as the code itself.
Generate API docs from code comments automatically.
Maintain architecture decision records (ADRs) in the repo.
Create runbooks for common operations and incidents.
Standardize Development Environments
Every hour developers spend fighting environment setup is wasted time that adds nothing to your product. Standardization eliminates this entire class of problems.
Implementation path:
Use containers to ensure consistency across local and production environments.
Provide one-command setup scripts that work for every repo.
Document environment requirements explicitly.
Test your setup instructions on new machines regularly.
Build Self-Service Infrastructure
Waiting on other teams for infrastructure needs creates dependencies that slow everyone down. Self-service removes these bottlenecks.
Examples of self-service:
Developers can provision databases and services through internal platforms.
Testing environments are automatically spun up from the configuration.
Deployment happens through automated pipelines without manual approvals.
Implement Intelligent Automation
Automation should eliminate toil, not create new brittleness. Focus on automating the repetitive tasks that add no value but consume time.
High-value automation targets:
Linting and formatting (never debate code style again).
Security scanning and dependency updates.
Test execution and coverage reporting.
Deployment processes from commit to production.
Also read: How to Measure Developer Productivity Effectively
Turn Developer Experience Metrics Into Action with Entelligence AI
By now, you understand what developer experience metrics reveal and why they matter. The harder part is acting on them. Most engineering teams do not struggle with knowing what to measure. They struggle with turning scattered signals into timely, actionable decisions.
DevEx initiatives often fail because measurement becomes another project. Data lives across tools, insights arrive too late, and teams only discover friction after velocity drops or morale suffers. What teams need is continuous visibility into developer experience, built directly into everyday workflows.
Entelligence AI is designed for this exact gap. Instead of adding dashboards or manual analysis, it connects DevEx metrics to real engineering activity and surfaces insight where work already happens.
Here is how that translates into action across the DevEx lifecycle.
Sprint Assessment Dashboards
Make delivery friction visible while there is still time to correct it.
Track planned versus completed work automatically across every sprint.
Identify repeated spillovers, estimation drift, and uneven work distribution in real time.
Detect early signals of hidden friction, such as growing complexity, unclear requirements, or dependency delays.
This allows leaders to adjust scope, support, or process before frustration compounds.
Contextual PR Insights
Reduce review friction without trading off code quality.
Surface potential bugs, missing tests, and architectural issues directly in the IDE.
Cut back-and-forth on reviews by addressing mechanical feedback before opening a PR.
Shorten the time to first review and merge without pushing teams to rush.
Reviewers spend less time on basics and more time on meaningful design decisions.
Individual and Team Management
Spot emerging DevEx issues before they turn into burnout or attrition.
Monitor workflow patterns, recurring blockers, and workload imbalance using real activity data.
Identify teams or individuals who may need support without turning metrics into surveillance.
Expose systemic bottlenecks that repeatedly slow progress across sprints.
This makes it easier to rebalance work and address root causes early.
Automated Retrospectives
Turn metrics into learning instead of debate.
Generate retrospectives using real engineering data rather than recent memory.
Review concrete signals such as review times, deployment patterns, and work distribution.
Focus conversations on what changed, what worked, and what needs attention next.
Retrospectives shift from opinion-driven discussions to evidence-based improvement.
You will get end-to-end visibility into developer experience without adding cognitive load by integrating with tools like GitHub, Jira, and Slack; insights surface naturally within existing workflows rather than living in disconnected dashboards.
Conclusion
Developer experience metrics reveal the hidden friction that traditional engineering metrics completely miss. The 16 metrics covered in this guide provide comprehensive visibility into how your team actually works: the bottlenecks that slow them down, the interruptions that fragment their focus, and the satisfaction that predicts whether they will stay or leave.
But measurement without action is just data collection. You need to close the loop by using these insights to eliminate friction, improve processes, and create an environment where developers can do their best work sustainably.
Entelligence AI bridges the gap between measurement and action. The platform automatically captures DevEx metrics from your existing tools, surfaces insights directly in your workflow, and helps you understand team performance at both the individual and organizational level. You get the visibility you need to optimize developer experience without building measurement infrastructure or manually analyzing dashboards.
Book a demo with Entelligence AI today and see how data-driven DevEx improvements accelerate your entire organization.
FAQs
1. How long does it take to see results after improving developer experience?
Most teams notice reduced friction within weeks, while delivery stability and retention improvements typically appear over one to two quarters.
2. Can small engineering teams use DevEx metrics effectively?
Yes. Small teams benefit most by tracking fewer metrics, focusing on flow, review speed, and onboarding friction rather than broad dashboards.
3. How often should developer experience metrics be reviewed?
Review DevEx metrics every sprint for trends and quarterly for relevance, adjusting metrics as team structure, scale, or tooling changes.
4. Are DevEx metrics useful for non-product engineering teams?
Yes. Platform, infrastructure, and internal tools teams use DevEx metrics to identify bottlenecks, dependency delays, and tooling friction impacting other teams.
5. What is the biggest mistake teams make when adopting DevEx metrics?
The most common mistake is treating metrics as performance targets instead of signals, which leads to gaming numbers rather than improving systems.