


What Are SPACE Metrics and Why Teams Must Adopt Them?
Most teams still measure developer productivity using metrics that are easy to pull: commits, closed tickets, or release counts. These metrics show activity, but they rarely explain why work slows down, quality drops, or teams feel exhausted. Over time, leaders see output, while teams feel friction.
That gap is where real problems hide. In March 2025, LeadDev surveyed 617 engineering leaders and found that 22% of developers were experiencing severe burnout. Traditional productivity metrics failed to surface those warning signs early.
This is exactly the gap the SPACE metrics framework was created to address. In this blog, we will discuss what SPACE metrics are, why they matter, and how teams can use them to understand productivity beyond surface-level output.
Overview
SPACE metrics provide a multi-dimensional view of developer productivity, balancing satisfaction, performance, activity, collaboration, and flow for a complete understanding of team effectiveness.
The framework focuses on trends and patterns, not individual scores, helping you spot bottlenecks, friction points, and hidden issues across teams and workflows.
Each dimension offers unique insights, but the real value emerges when you interpret them together to diagnose systemic problems and workflow inefficiencies.
SPACE complements traditional metrics and DORA by capturing developer experience, collaboration, and process flow, revealing insights that raw numbers alone cannot.
Implementing SPACE successfully requires context, clear goals, selective metrics, and a focus on dialogue, not judgment, to drive continuous improvement.
What Is the SPACE Framework? (And Why It Exists)
The SPACE framework, developed by researchers including Nicole Forsgren and Margaret-Anne Storey, measures developer productivity based on evidence, not vendor hype. Its philosophy treats productivity as a system, considering satisfaction, performance, activity, collaboration, and flow, rather than reducing work to a single number.
Unlike performance scorecards, SPACE isn’t a ranking system or a score. It helps you see how work actually flows, where issues exist, and which practices drive real results. This gives you and your team actionable insights without turning into numbers on a spreadsheet.
Once the intent behind the SPACE framework is clear, the next step is breaking it down into its five dimensions to see what each one reveals in practice.
Also Read: 15 Leadership Strategies for Scaling Engineering Teams That Actually Work
The Five Dimensions of SPACE
The SPACE framework measures developer productivity across five interconnected dimensions: Satisfaction, Performance, Activity, Communication, and Efficiency. It captures both output and well-being for a complete, actionable view of engineering effectiveness.
Here are some key metrics to track for each dimension:
SPACE Dimension | Key Metrics | What They Indicate |
Satisfaction & Well-Being | Developer satisfaction surveys, eNPS, burnout indicators, work-life balance signals | Team morale, engagement, and the sustainability of work pace |
Performance | Code quality, defect rates, feature delivery success, production incidents | Effectiveness of engineering output and reliability of releases |
Activity | Commit frequency, PR volume, work-in-progress, coding vs non-coding time | How work progresses day-to-day (not a proxy for individual productivity) |
Communication & Collaboration | PR review time, feedback cycles, cross-team interactions, and documentation quality | Health of collaboration and knowledge flow |
Efficiency & Flow | Lead time, cycle time, deployment frequency, wait times | How smoothly work moves from idea to production |
Note: These metrics are indicators, not targets. Teams should select a small, context-specific set that reflects their goals rather than tracking everything at once.
With all five dimensions laid out side by side, let’s look at each one individually, starting with satisfaction and well-being. It often signals problems before delivery metrics change.
1. Satisfaction & Well-Being
Satisfaction and well-being reflect whether your developers feel supported, challenged, and balanced. Subtle signs like disengagement, quiet frustration, or missed feedback loops often indicate underlying stress or burnout that can quietly derail delivery and team cohesion.
Red flag pattern: You’re still shipping on time, but fewer developers respond to surveys, retros feel quieter, and the same unresolved tensions quietly carry over sprint after sprint.
How to measure: Track developer surveys, eNPS, burnout indicators, and work-life balance signals over time. Trends reveal morale patterns, while avoiding overemphasis on individual scores ensures insights guide team-level improvements rather than judgment.
2. Performance
Performance captures whether engineering output delivers impact, reliability, and quality, not just activity. Your team may appear busy while producing inconsistent releases or overlooked defects. Patterns in repeated incidents or delayed features often reveal deeper gaps in effectiveness.
Red flag pattern: From the outside, releases look predictable, yet you notice familiar production issues returning and fixes that don’t seem to reduce future risk.
How to measure: Monitor defect rates, feature delivery success, production incidents, and code quality metrics. Observing team-level trends over time highlights where outcomes meet expectations and where improvements can increase reliability and impact.
3. Activity
Activity shows how work flows through the team day-to-day without being a proxy for productivity. Irregular commits, stalled pull requests, or imbalanced coding vs. non-coding time can signal blockers, context gaps, or workflow inefficiencies that quietly accumulate.
Red flag pattern: You see plenty of commits and pull requests, but work often pauses in review or waits on handoffs longer than anyone expects.
How to measure: Track commit frequency, PR volume, work-in-progress, and coding versus non-coding time. Focus on spotting friction points and understanding patterns rather than judging individual effort.
4. Communication & Collaboration
Communication and collaboration reveal how knowledge and feedback move across the team. Delayed PR reviews, weak feedback cycles, or uneven cross-team coordination often signal friction that can slow decision-making and reduce delivery predictability.
Red flag pattern: You keep revisiting the same alignment questions across teams, even after decisions were discussed, documented, and seemingly agreed upon.
How to measure: Measure PR review time, feedback cycle speed, cross-team interactions, and documentation quality. Patterns help uncover where information flow is breaking down and where adjustments can improve alignment.
5. Efficiency & Flow
Efficiency and flow show how smoothly work moves from idea to production. Bottlenecks, wait states, or repeated rework often create hidden drag, making “busy” teams feel productive while true throughput stagnates.
Red flag pattern: You’re deploying regularly, yet it feels like work takes longer to move end-to-end, with more waiting than forward momentum.
How to measure: Track lead time, cycle time, deployment frequency, and blocked work. Monitoring these metrics helps identify friction points and prioritize process improvements that support delivery without overloading the team.
Individually, each dimension tells part of the story. To understand real productivity, you need to see how these dimensions interact and influence one another.
How do SPACE Framework Metrics Work Together?
SPACE only works when you read the dimensions together, because one “good” number can hide a real problem elsewhere. For example:
If Activity looks strong (many PRs, frequent commits) but Satisfaction drops, you may be running the team at an unsustainable pace.
If Efficiency improves (shorter cycle time) but Performance degrades (more incidents), you may be shipping faster by taking on quality risk.
If Performance is stable but Communication is weak (slow reviews, poor docs), you may be accumulating future delivery friction.
Treat SPACE like a diagnostic lens: use it to form hypotheses about the system, then validate those hypotheses with the team before changing the process.
With a system-level view in mind, it is helpful to compare SPACE with other common measurement approaches to understand what each captures and what it leaves out.
SPACE vs. DORA vs. Traditional Metrics
DORA tracks release efficiency, traditional metrics capture raw output, and SPACE reveals developer satisfaction, collaboration, and flow. Each highlights different truths; here’s a clear comparison to see how they complement each other.
Metric Approach | What It Captures | Why It Matters |
DORA | Deployment frequency, lead time, change failure rate, MTTR | Shows delivery efficiency and release stability, but ignores team dynamics |
SPACE | Satisfaction, performance, activity, collaboration, flow | Balances output with developer experience, revealing hidden friction and bottlenecks |
Traditional Metrics | Lines of code, story points, hours logged | Tracks raw activity but often misrepresents true productivity and team health. |
Understanding the differences is useful, but real value comes from application. Let’s now walk through how teams can apply SPACE metrics in real-world settings.
Also Read: How to Reduce Bugs in Code: 7 Strategies That Work
Step-by-Step Implementing SPACE in Real Teams
Before you collect a single metric, understand what you want to achieve. Implementing SPACE is about actionable insights, not dashboards. The steps below guide you to measure, interpret, and improve sustainably.
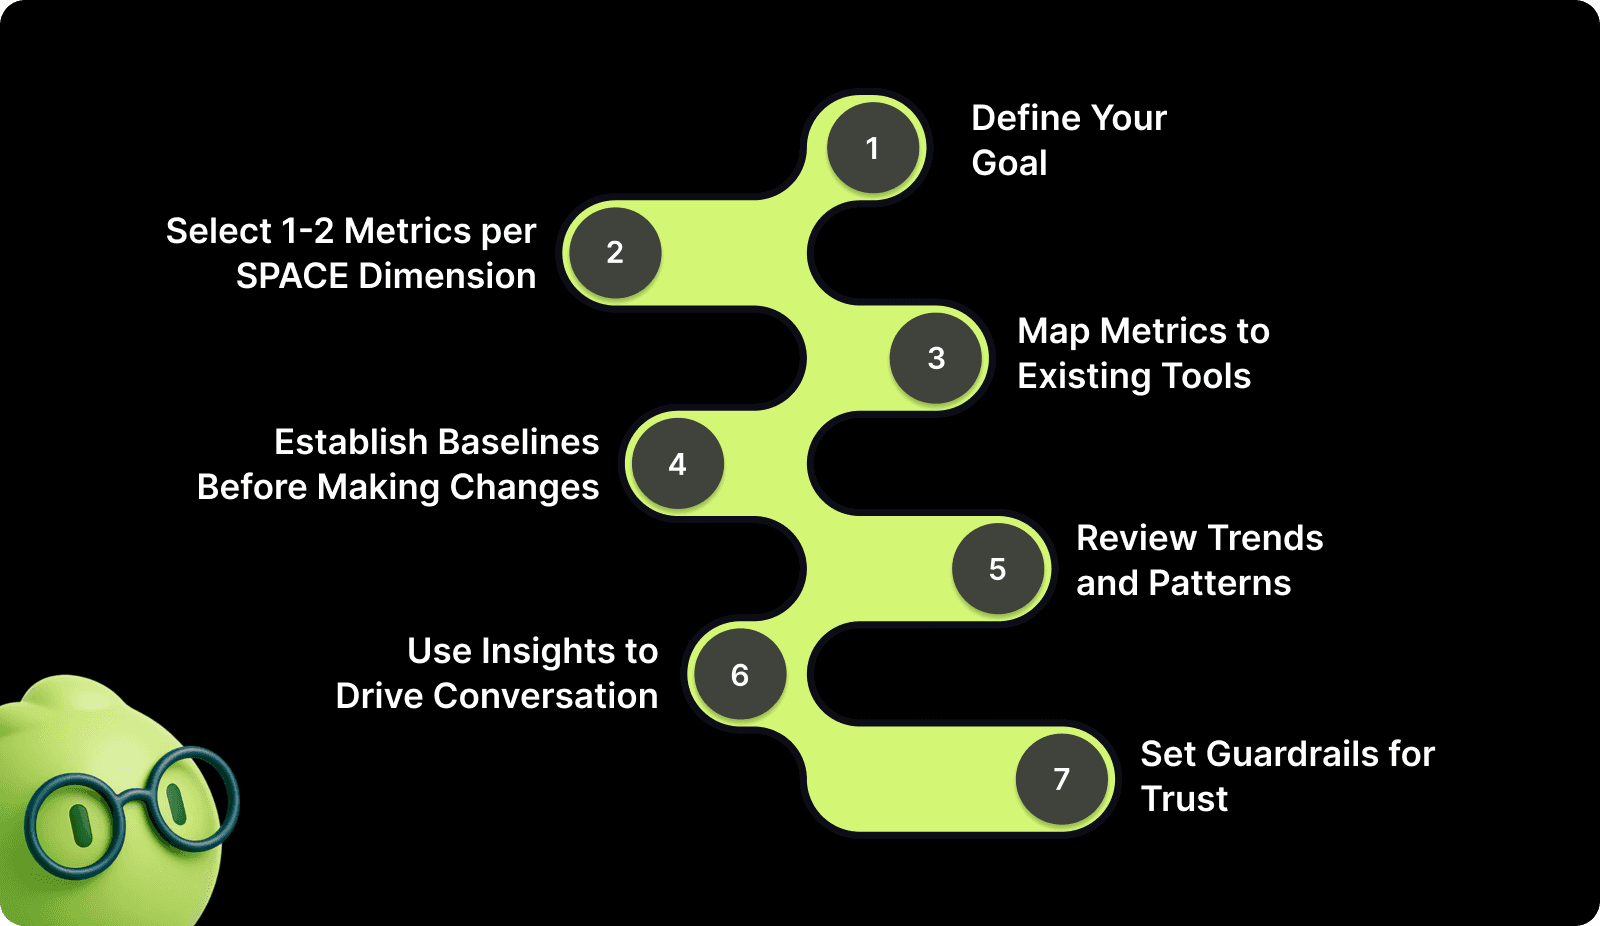
1. Define Your Goal
Identify whether your focus is on visibility into team performance, code quality, delivery speed, developer wellbeing, or alignment across teams. Clear goals prevent collecting data that doesn’t inform real decisions.
How you can start:
Prioritize one primary objective per quarter to avoid analysis paralysis.
Align your goal with leadership expectations and team priorities.
Frame the goal in a way your team can relate to. E.g., “reduce blocked PRs” instead of “improve team velocity.”
2. Select 1-2 Metrics per SPACE Dimension
Choosing a limited number of metrics helps you focus on meaningful signals instead of tracking everything at once. Concentrate on measures that reveal friction, highlight improvement opportunities, and align with your team’s goals.
Here’s what works best:
Track trends over time rather than single data points to see real improvements or setbacks.
Compare related dimensions; for example, pairing activity with satisfaction, to detect if high output is causing burnout.
Use metrics to spark discussions with the team, not to evaluate individuals.
Monitor anomalies in context; a sudden spike or drop might indicate a process issue, not a performance problem.
Adjust your metrics gradually, adding or retiring them as team priorities change.
3. Map Metrics to Existing Tools
Utilize tools your team already uses to reduce friction and improve adoption. Don’t force new tools unless they provide unique, actionable data.
How to connect the dots:
Extract commit and PR data from Git or GitHub for activity tracking.
Link CI/CD pipelines to deployment frequency and cycle time automatically.
Use internal surveys or Slack polls for real-time satisfaction feedback.
4. Establish Baselines Before Making Changes
You need context to know if changes work. Without baselines, spikes or drops can mislead, and teams can overreact to normal fluctuations.
Where to begin:
Collect at least one month of historical metrics across all selected dimensions.
Compare individual and team trends separately to catch hidden bottlenecks.
Document baseline anomalies, such as unusually high PR volume during release week.
5. Review Trends and Patterns
Look for patterns over time. One-off data points rarely reflect reality and can drive poor decisions if taken in isolation.
Watch for signals:
Compare metrics sprint-over-sprint to identify gradual improvements or declines.
Spot recurring delays in PR review or deployment to address systemic issues.
Highlight positive trends to reinforce effective practices rather than just pointing out problems.
6. Use Insights to Drive Conversation
SPACE is a diagnostic tool, not a scoreboard. Insights should spark discussion about process, workflow, and well-being. It should not rank individuals or teams.
Turn data into dialogue:
Share insights openly and use them to co-create solutions with the team.
Focus on actionable patterns, e.g., repeated PR delays indicate process gaps, not laziness.
Reinforce psychological safety by framing metrics as learning opportunities, not judgment.
7. Set Guardrails for Trust
SPACE adoption breaks down fastest when teams fear metrics will be used for surveillance, rankings, or performance reviews. Without clear guardrails, even well-intended measurements can reduce transparency, distort behavior, and undermine developer well-being.
How to protect trust:
Explicitly state that SPACE metrics will not be used for individual performance evaluation or compensation decisions.
Share who can access which metrics and why, to avoid silent monitoring.
Review insights at a team or system level, focusing on workflows and constraints rather than people.
Even with the right steps, measurement can go wrong. Before moving forward, it’s important to recognize common pitfalls that weaken SPACE insights.

Pitfalls That Undermine SPACE Insights
Even well-intentioned teams sometimes see distorted signals from SPACE metrics. Misalignment usually occurs when metrics are taken out of context, overused, or interpreted as judgment rather than insight. Here are the pitfalls to watch out for closely:
Ranking Developers: When metrics are treated as a scoreboard, collaboration can feel competitive, and insights get overshadowed by comparison.
Metric Overload: Tracking too many data points can dilute focus, making meaningful trends harder to spot and increasing cognitive strain.
Ignoring Context: Numbers alone rarely tell the full story. Team dynamics, workload, and external factors often explain anomalies better.
Control Mindset: Using metrics as levers of authority rather than a reflection of workflow can unintentionally reduce trust and engagement.
Once you’re aware of the risks, the next question is fit. Let’s clarify when SPACE metrics are most useful and when teams should pause or delay adoption.
When (and When Not) to Use SPACE?
SPACE is most effective when you need a multi-dimensional view of engineering work, beyond velocity or bug counts, to understand trends, bottlenecks, and team well-being across teams and sprints.
Use SPACE if: You want clarity on how work flows across repos and teams, spot friction points early, and identify patterns that affect both delivery quality and developer satisfaction.
Avoid or delay SPACE if: Your workflows are inconsistent, metrics risk being misinterpreted as individual performance scores, or teams don’t trust leadership to treat the insights as a lens.
With a clear understanding of where SPACE applies, the next step is seeing how engineering teams can ground these insights in day-to-day execution.
Also Read: Top 34 Continuous Integration Metrics Every Engineering Team Should Track
Turning Execution Signals Into Engineering Clarity With Entelligence AI
As engineering teams scale, leaders struggle to connect daily code activity to broader outcomes such as quality, delivery confidence, and sustainable pace. Reviews pile up, risks surface late, and visibility fragments across tools, leaving decision-making reactive instead of grounded.
Entelligence AI supports this gap by anchoring engineering insights directly in the code review process. Rather than acting as a standalone metric system, it surfaces execution-level signals around quality, security, and collaboration. The platform helps teams and leaders understand patterns without reducing work to performance scores.
Key Features of Entelligence AI:
AI-Assisted Code Reviews: Highlight quality, maintainability, and risk signals during pull requests, helping teams catch issues earlier in the development cycle.
Security Insights in Review: Surface potential security concerns within code reviews, reducing late-stage surprises without shifting security entirely left.
Collaboration & Review Signals: Provide visibility into review cycles, feedback timing, and participation patterns to identify friction in team workflows.
Team-Level Trend Visibility: Aggregate repository-level signals to show patterns over time, supporting informed discussions at the team and leadership level.
Unified Engineering Context: Connect day-to-day code execution with broader engineering visibility, without turning metrics into individual performance scores.
Entelligence AI grounds engineering metrics in real work, enabling clearer conversations about how software is actually being built.

Conclusion
SPACE metrics help teams see what traditional productivity numbers miss. By looking at satisfaction, performance, activity, collaboration, and flow together, teams can identify where work slows down. It also gives a fair idea of where quality drops and where pressure quietly builds before those issues show up as missed deadlines or attrition.
Entelligence AI fits into this model by anchoring productivity insights directly in code review workflows. It analyzes pull requests to surface quality risks, security issues, review bottlenecks, and collaboration gaps at a team level without scoring or ranking individual developers.
Book a demo today to see how Entelligence supports SPACE-aligned visibility using real code activity without turning productivity measurement into surveillance.
FAQs
1. Is SPACE meant for individual performance reviews?
No. SPACE is designed to highlight team and workflow patterns. Using it for individual rankings risks misinterpretation and undermines trust, as it focuses on signals, not personal evaluation.
2. How long does it take to see meaningful insights?
You’ll usually start spotting patterns within one to two sprints. However, meaningful trends, especially for satisfaction and flow, require consistent data collection over several months to account for variability.
3. Can small teams use SPACE effectively?
Yes. Even small teams benefit from tracking a few key metrics per dimension. Insights help identify bottlenecks, improve coordination, and understand team well-being without overwhelming the process.
4. How does SPACE grow as teams scale?
As teams scale, you may expand dimensions or refine metrics. SPACE scales by shifting focus from individual contributions to systemic patterns, cross-team interactions, and broader workflow efficiencies.
5. Is SPACE compatible with Agile and DevOps workflows?
Absolutely. SPACE complements Agile and DevOps by measuring outcomes, flow, and collaboration without disrupting sprints or CI/CD cycles. It provides visibility into both process efficiency and developer experience.